Мы шукаем новы спосаб стварэння эфектыўнай прэзентацыя вынікаў апытання? Праверце лепшае кіраўніцтва з 4 інструкцыямі з AhaSlides!
Калі справа даходзіць да прэзентацыі вынікаў апытання, людзі думаюць аб'яднаць усе вынікі апытання ў ppt і прадставіць іх свайму начальніку.
Аднак паведамленне аб выніках апытання вашаму начальніку можа быць складанай задачай. Усё пачынаецца з распрацоўкі дызайну апытання, разумення мэтаў апытання, што трэба хаваць, якія важныя высновы або адфільтравання неістотных і дробязных водгукаў, а затым прадстаўлення іх у прэзентацыі за абмежаваны час.
Увесь гэты працэс займае даволі шмат часу і намаганняў, але ёсць спосаб вырашыць праблему: разумеючы сутнасць апытання і прэзентацыю вынікаў апытання, вы цалкам можаце зрабіць уражлівую прэзентацыю для вышэйшага кіраўніцкага звяна.
Змест
- Што такое прэзентацыя вынікаў апытання
- Перавагі прэзентацыі вынікаў апытання
- Як наладзіць прэзентацыю вынікаў апытання?
- #1 Засяродзьцеся на лічбах
- #2 Выкарыстанне візуальных элементаў
- #3 Аналіз якасных дадзеных
- #4 Выкарыстоўвайце інтэрактыўны інструмент для апытанняў
- Найлепшыя пытанні апытання
- Bottom Line
- Questions fréquemment posées

Парады для лепшага ўзаемадзеяння
Што такое прэзентацыя вынікаў апытання?
Літаральна, прэзентацыя вынікаў апытання - гэта выкарыстанне візуальнага спосабу апісання вынікаў апытання, каб атрымаць больш глыбокае разуменне тэмы, гэта можа быць справаздача PPT з вынікамі і абмеркаванне апытання аб задаволенасці супрацоўнікаў, апытанне аб задаволенасці кліентаў, апытанне аб ацэнцы навучання і курсаў, маркетынгавае даследаванне і многае іншае.
Няма абмежаванняў на тэмы апытання і пытанні прэзентацыі.
Кожнае апытанне будзе мець мэту, якую трэба дасягнуць, і прэзентацыя вынікаў апытання з'яўляецца апошнім этапам ацэнкі таго, ці дасягнуты гэтыя мэты і што арганізацыя можа даведацца і зрабіць паляпшэнні з гэтых вынікаў.
Перавагі прэзентацыі вынікаў апытання
Нягледзячы на тое, што ваш начальнік і вашы партнёры могуць лёгка спампаваць або раздрукаваць справаздачы аб апытаннях у фармаце PDF, прэзентацыя неабходная, бо не ў многіх з іх ёсць дастаткова часу, каб прачытаць сотні старонак слоў.
Прэзентацыя вынікаў апытання карысная, бо яна можа дапамагчы людзям хутка атрымаць карысную інфармацыю аб выніках апытання, даць групам час для сумеснага абмеркавання і вырашэння праблемы падчас правядзення апытання або спрыяць прыняццю рашэнняў і дзеянням.
Больш за тое, дызайн прэзентацыі вынікаў апытання з дапамогай графікі, маркаванага спісу і малюнкаў можа прыцягнуць увагу аўдыторыі і адпавядае логіцы прэзентацыі. Гэта больш гнутка для абнаўлення і рэдагавання нават падчас прэзентацыі, калі вы хочаце запісаць ідэі і меркаванні вашых кіраўнікоў.
🎉 Зручны ў выкарыстанні дошка ідэй лепш сістэматызаваць меркаванні!

Як наладзіць прэзентацыю вынікаў апытання?
Як прадставіць вынікі апытання ў справаздачы? У гэтай частцы вы атрымаеце некалькі найлепшых парад па правядзенні прэзентацыі вынікаў апытання, каб усе прызналі і ацанілі вашу працу. Але перад гэтым пераканайцеся, што вы ведаеце розніцу паміж акадэмічным апытаннем і бізнес-апытаннем, каб вы ведалі, што важна сказаць, што хоча ведаць ваша аўдыторыя і многае іншае.
- Засяродзьцеся на лічбах
Параўноўвайце лічбы ў перспектыве, напрыклад, шмат ці мала «15 працэнтаў» у вашым кантэксце. І акругліце лічбу, калі гэта магчыма. Бо, хутчэй за ўсё, аўдыторыі неабавязкова ведаць, ці складае ваш рост 20.17% ці 20% з пункту гледжання прэзентацыі, і акругленыя лічбы значна лягчэй запомніць.
- Выкарыстанне выяўленчых элементаў
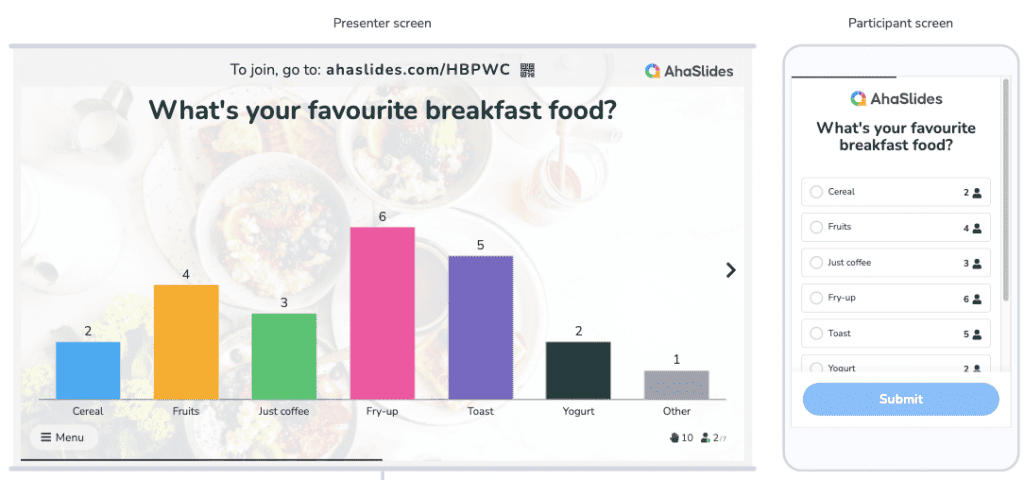
Лічба можа раздражняць, калі людзі не разумеюць сюжэт, які за ёй стаіць. Дыяграмы, графікі і ілюстрацыі... з'яўляюцца найважнейшай часткай эфектыўнага адлюстравання дадзеных у прэзентацыі, асабліва пры справаздачнасці аб выніках апытання. Пры пабудове дыяграмы або графіка рабіце вынікі максімальна зручнымі для чытання. Абмяжуйце колькасць адрэзкаў і тэкставых варыянтаў.
- Аналіз якасных дадзеных
Ідэальнае апытанне збірае як колькасныя, так і якасныя дадзеныя. Падрабязныя звесткі аб выніках важныя для таго, каб аўдыторыя магла зразумець корань праблемы. Але як эфектыўна пераўтварыць і інтэрпрэтаваць якасныя дадзеныя, не губляючы іх першапачатковага сэнсу, і ў той жа час пазбегнуць сумных вынікаў?
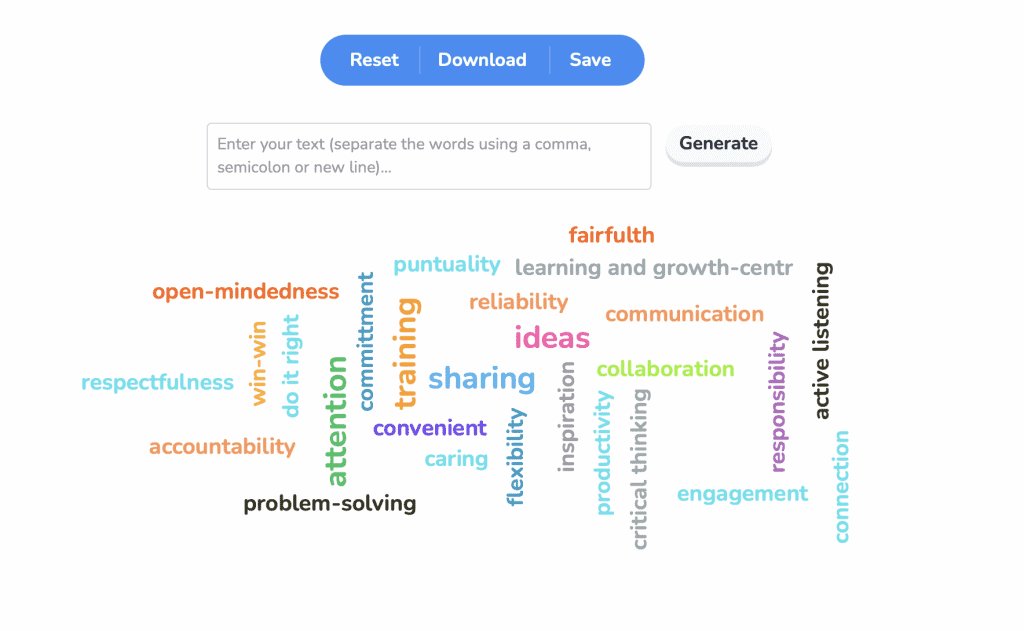
Калі вы хочаце засяродзіцца на вылучэнні адкрытых адказаў з дапамогай тэкстаў, вы можаце разгледзець магчымасць выкарыстання аналізу тэксту, каб зрабіць гэта. Калі вы змяшчаеце ключавыя словы ў a слова воблака, ваша аўдыторыя можа хутка зразумець важныя моманты, што можа спрыяць генерацыі інавацыйных ідэй.
- Выкарыстоўвайце інструмент інтэрактыўнага апытання
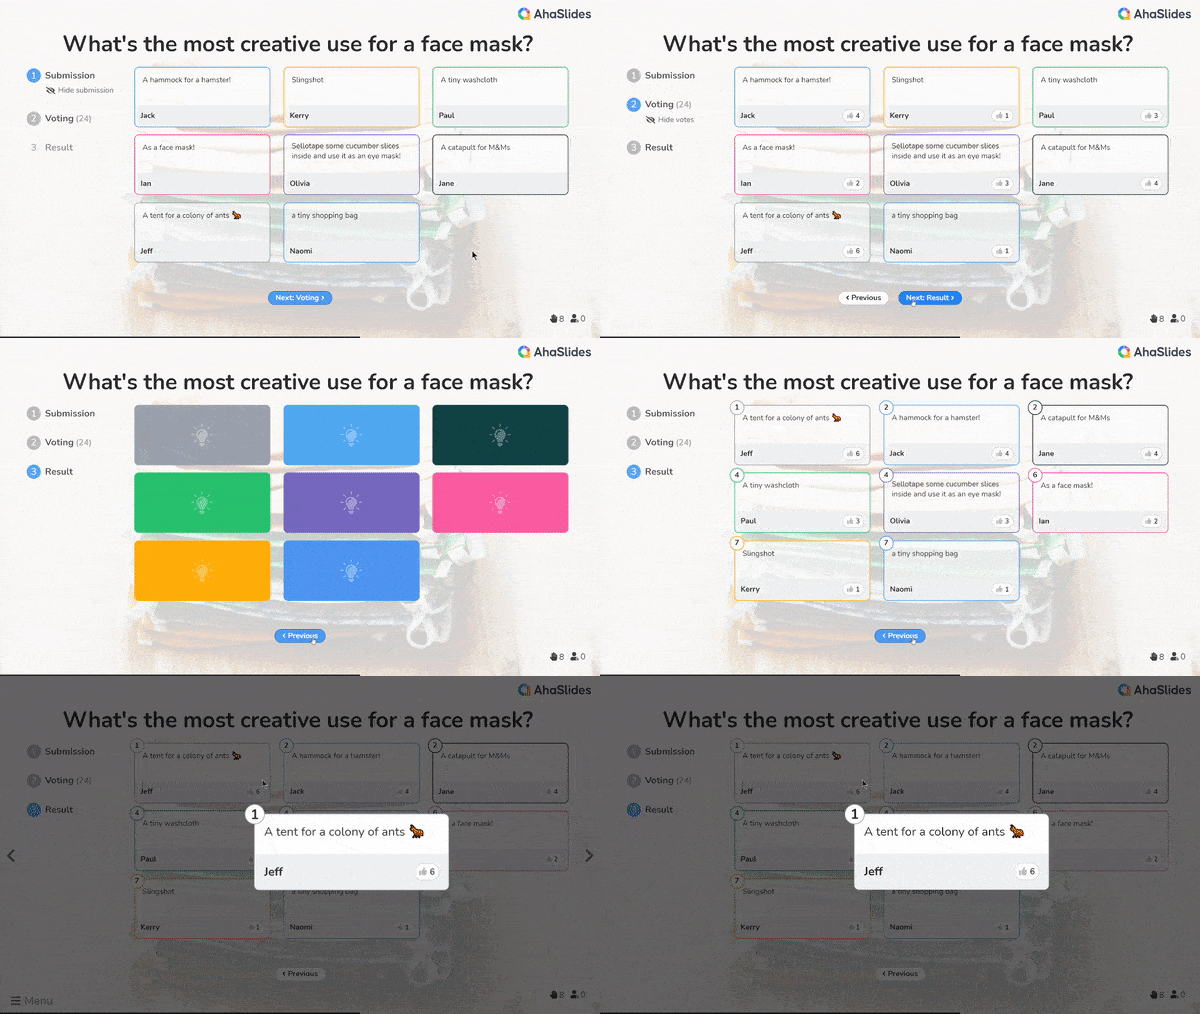
Колькі часу вам патрабуецца, каб стварыць апытанне, сабраць, прааналізаваць і традыцыйна паведаміць пра дадзеныя? Чаму б не выкарыстоўваць інтэрактыўнае апытанне каб паменшыць вашу працоўную нагрузку і павысіць прадукцыйнасць? з AhaSlides, Вы можаце наладзіць апытанні, і розныя тыпы пытанняў, такіх як калаўрот, рэйтынгавая шкала, стваральнік онлайн-віктарыны, слова хмары, жывыя пытанні і адказы... з абнаўленнямі вынікаў у рэжыме рэальнага часу. Вы таксама можаце атрымаць доступ да аналітыкі вынікаў з дапамогай жывой слупковай, дыяграмнай, лінейнай ...
Пытанні апытання для прэзентацыі вынікаў апытання
- Якую ежу вы хочаце мець у сталоўцы кампаніі?
- Ці здаецца, што ваш кіраўнік ці хтосьці на працы клапоціцца пра вас, калі вы сутыкаецеся з цяжкасцямі?
- Што лепшае ў вашай працы?
- Якія вашы любімыя паездкі кампаніі?
- Менеджэры даступныя і справядлівыя ў адносінах?
- Якую частку кампаніі, на вашу думку, варта палепшыць?
- Ці падабаецца вам удзельнічаць у карпаратыўных трэнінгах?
- Вам падабаюцца мерапрыемствы па стварэнні каманды?
- Якая ваша мэта ў кар'еры на бліжэйшыя 5 гадоў?
- Вы хочаце ўзяць на сябе абавязацельствы кампаніі ў наступныя 5 гадоў?
- Ці ведаеце вы каго-небудзь, хто стаў ахвярай пераследу ў нашай кампаніі?
- Ці лічыце вы, што ў кампаніі ёсць роўныя магчымасці для асабістага кар'ернага росту і развіцця?
- Ці з'яўляецца ваша каманда крыніцай матывацыі для таго, каб рабіць усё магчымае ў працы?
- Які план пенсійнай кампенсацыі вы аддаеце перавагу?

Пачаць за лічаныя секунды.
Шукаеце шаблоны прэзентацыі вынікаў апытання? Зарэгіструйцеся бясплатна і вазьміце тое, што хочаце, з бібліятэкі шаблонаў!
🚀 Да аблокаў ☁️
Ref: загадзя
Bottom Line
Гэта вялікая памылка - дазваляць дадзеным гаварыць самі за сябе, бо прадстаўленне вынікаў апытання кіраўнікам патрабуе большага. Выкарыстоўваючы прыведзеныя вышэй парады і працуючы з такім партнёрам, як AhaSlides можа дапамагчы вам зэканоміць час, чалавечыя рэсурсы і бюджэт шляхам стварэння візуалізацыі даных і абагульнення ключавых момантаў.
Падрыхтуйцеся прадставіць свае вынікі. Зарэгіструйцеся. AhaSlides неадкладна вывучыць высакародны спосаб зрабіць найлепшую прэзентацыю вынікаў апытання.
Questions fréquemment posées
Ёсць пытанне? У нас ёсць адказы.

