

अधिकांश सर्वेक्षण डेटा का कोई उपयोग नहीं होता। टीमें सर्वेक्षण चलाएँआंकड़े संकलित करें, और फिर एक सर्वेक्षण परिणाम प्रस्तुति तैयार करें जिसमें प्रत्येक प्रश्न और उसका प्रतिशत विवरण शामिल हो। हितधारक बैठक में बस सहमति जताते रहते हैं, प्रस्तुति को एक तरफ रख दिया जाता है, और कुछ नहीं बदलता। क्या यह जाना-पहचाना सा लगता है?
समस्या अक्सर डेटा में नहीं होती। समस्या उसके प्रस्तुतीकरण में होती है। यह मार्गदर्शिका सर्वेक्षण परिणामों को संरचित करने, उनका दृश्य प्रस्तुत करने और उन्हें इस प्रकार प्रस्तुत करने के बारे में बताती है कि निष्कर्ष निर्णयों को दिशा दें, न कि केवल एक संग्रह फ़ोल्डर में भर जाएं। मैकिन्से ग्लोबल इंस्टीट्यूट की एक रिपोर्ट में पाया गया कि डेटा-संचालित संगठनों के ग्राहक प्राप्त करने की संभावना 23 गुना और लाभ कमाने की संभावना 19 गुना अधिक होती है, फिर भी अधिकांश सर्वेक्षण निष्कर्ष कभी भी निर्णयों में परिवर्तित नहीं होते क्योंकि उन्हें स्पष्ट विवरण के बिना प्रस्तुत किया जाता है [5]।
सर्वेक्षण परिणामों की प्रस्तुति को वास्तव में क्या करना चाहिए
चार्ट का प्रकार चुनने या शीर्षक स्लाइड लिखने से पहले, यह स्पष्ट कर लें कि प्रस्तुति का उद्देश्य क्या है। सर्वेक्षण परिणाम प्रस्तुति को तीन कार्य करने होते हैं:
- दर्शकों को बताएं कि आपको क्या मिला।
- उन्हें यह समझाएं कि यह उनके लिए विशेष रूप से क्यों मायने रखता है।
- आगे क्या होना चाहिए, इस ओर इशारा करें।
बाकी सब तो सजावट है। एक प्रस्तुति में बैठे अधिकारी कर्मचारी को काम पर लगाना डेटा का इस्तेमाल कार्यप्रणाली की समीक्षा के लिए नहीं किया जा सकता। वे जानना चाहते हैं कि आंकड़े संगठन की स्थिति के बारे में क्या कहते हैं और क्या बदलाव होने चाहिए। प्रशिक्षण मूल्यांकन परिणामों की समीक्षा करने वाले मानव संसाधन पेशेवर यह जानना चाहते हैं कि कौन से कार्यक्रम कारगर हैं और किन कार्यक्रमों को फिर से तैयार करने की आवश्यकता है। पहली स्लाइड से पहले रूपरेखा महत्वपूर्ण होती है।
चरण 1: कुछ भी बनाने से पहले अपने लक्षित दर्शकों को जान लें
एक ही सर्वेक्षण डेटा को कमरे में मौजूद व्यक्तियों के आधार पर अलग-अलग तरीके से प्रस्तुत करने की आवश्यकता होती है। विस्तृत विश्लेषण के लिए लाइकेर्ट स्केल दस प्रश्नों में विभाजित जानकारी मानव संसाधन विश्लेषकों की टीम के लिए उपयुक्त है। सीएफओ को दी जाने वाली यही जानकारी दो या तीन मुख्य निष्कर्षों में संक्षेपित की जानी चाहिए, जो सीधे व्यावसायिक परिणामों से जुड़े हों।
अपनी प्रस्तुति या रिपोर्ट तैयार करने से पहले, इन प्रश्नों के उत्तर दें:
- इस श्रोता वर्ग को क्या निर्णय लेना होगा?
- सर्वेक्षण और उसके लक्ष्यों के बारे में उन्हें पहले से कितनी जानकारी है?
- उन्हें प्रस्तुति की समीक्षा करने या उसे देखने के लिए कितना समय मिलेगा?
- उन्हें किस स्तर का सांख्यिकीय विवरण उपयोगी लगेगा और किस स्तर का विवरण उन्हें बोझिल लगेगा?
नेतृत्वकर्ताओं के लिए, सबसे महत्वपूर्ण निष्कर्ष से शुरुआत करें। व्यावहारिक श्रोताओं के लिए, आप अधिक जानकारी जोड़ सकते हैं। मिश्रित बैठकों के लिए, प्रस्तुति को इस प्रकार संरचित करें कि मुख्य निष्कर्ष पहले आएं और सहायक डेटा बाद में, ताकि हितधारक मुख्य बिंदुओं को समझने के बाद जा सकें और विश्लेषणात्मक टीम शेष जानकारी के लिए रुक सके।
चरण 2: डेटा को विज़ुअलाइज़ करने से पहले उसे फ़िल्टर करें
30 प्रश्नों वाले सर्वेक्षण से 30 डेटा पॉइंट प्राप्त होते हैं, लेकिन इसका मतलब यह नहीं है कि आप सभी 30 डेटा पॉइंट प्रस्तुत करें। अधिकांश सर्वेक्षणों में तीन से पाँच निष्कर्ष ही ऐसे होते हैं जो वास्तव में संबंधित निर्णयों के लिए महत्वपूर्ण होते हैं। बाकी सब बस संदर्भ मात्र होता है, और अंततः अनावश्यक जानकारी।
अपने परिणामों का विश्लेषण करें और पूछें: इनमें से कौन से निष्कर्ष आश्चर्यजनक, महत्वपूर्ण या कार्रवाई योग्य हैं? एक ऐसा प्रश्न जिसका 94% उत्तरदाताओं ने एक ही उत्तर दिया हो, उससे लगभग कोई उपयोगी जानकारी नहीं मिलती: इसे हटाया जा सकता है। एक ऐसा प्रश्न जिसमें विभागों के बीच प्रतिक्रियाएँ स्पष्ट रूप से विभाजित हों, या जहाँ पिछले सर्वेक्षण चक्र के बाद से रुझान में महत्वपूर्ण बदलाव आया हो, आमतौर पर प्रस्तुति में शामिल किया जाना चाहिए।
प्रस्तुतकर्ता अक्सर फ़िल्टरिंग के इस चरण में ही कम ध्यान देते हैं। सब कुछ दिखाना विस्तृत लगता है, लेकिन यह किसी पाठ्यपुस्तक की हर पंक्ति को हाइलाइट करने जैसा है: जब हर चीज़ को महत्वपूर्ण के रूप में चिह्नित किया जाता है, तो कुछ भी महत्वपूर्ण नहीं रह जाता।
चरण 3: डेटा से मेल खाने वाले चार्ट प्रकारों का चयन करें
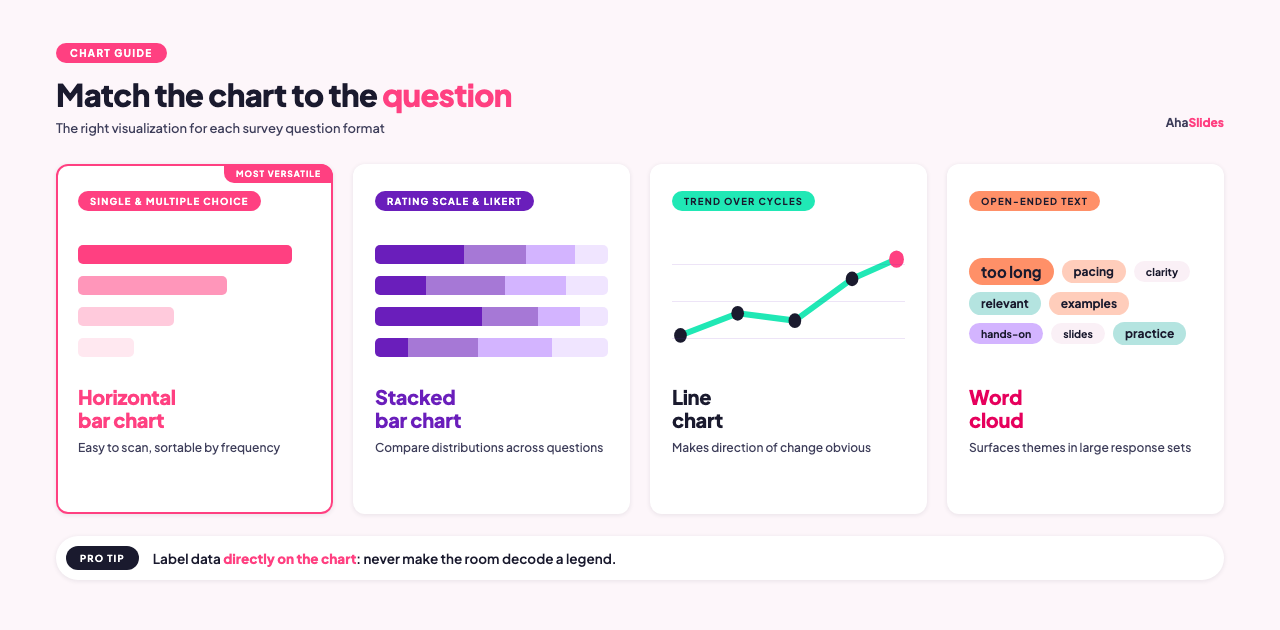
विभिन्न प्रश्न प्रारूपों के लिए अलग-अलग विज़ुअलाइज़ेशन की आवश्यकता होती है। गलत चार्ट प्रकार का उपयोग करने से सटीक डेटा को समझना कठिन हो जाता है।
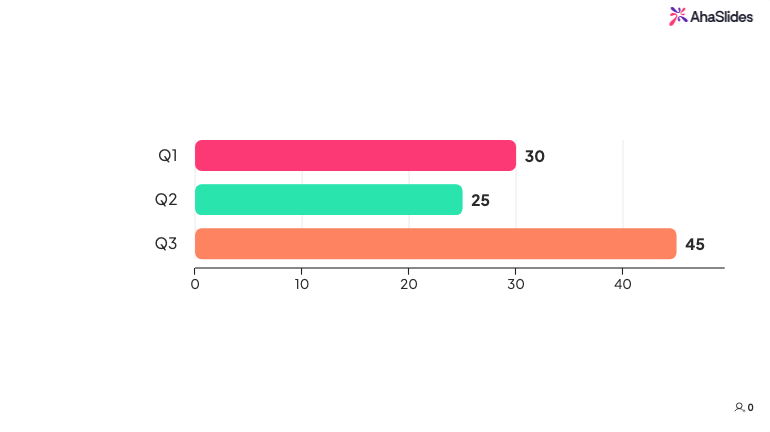
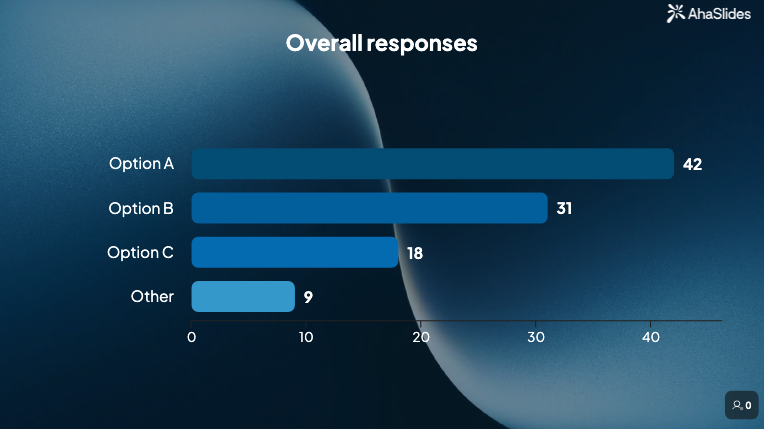
एक विकल्प और बहुविकल्पीय प्रश्न क्षैतिज बार चार्ट के रूप में पाई चार्ट अच्छे काम करते हैं। बार चार्ट को स्कैन करना आसान होता है, इनमें कितनी भी श्रेणियां शामिल हो सकती हैं, और आप प्रतिक्रियाओं को आवृत्ति के आधार पर क्रमबद्ध कर सकते हैं जिससे पैटर्न तुरंत दिखाई देते हैं [1]। पाई चार्ट चार या उससे कम विकल्पों वाले एकल-विकल्प प्रश्नों के लिए उपयुक्त होते हैं जहां अनुपात-से-संपूर्ण कहानी मुख्य बिंदु होती है, लेकिन पांच से अधिक स्लाइस होने पर इन्हें पढ़ना मुश्किल हो जाता है।
रेटिंग स्केल और लिकर्ट प्रश्न इन्हें स्टैक्ड बार चार्ट के रूप में सबसे अच्छी तरह से दिखाया जाता है, जहाँ प्रत्येक बार एक प्रश्न का प्रतिनिधित्व करता है और खंड पैमाने पर प्रतिक्रियाओं के वितरण को दर्शाता है [2]। यह आपको एक ही दृश्य में कई प्रश्नों में प्रतिक्रिया पैटर्न की तुलना करने देता है।
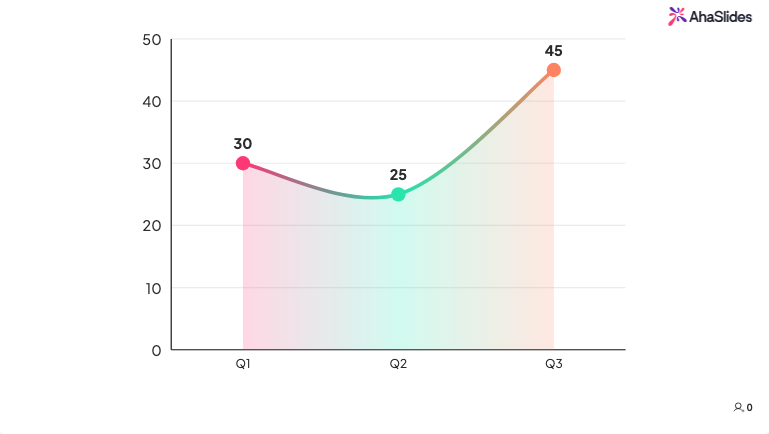
रुझान डेटाइस चक्र के परिणामों की तुलना पिछले चक्र के परिणामों से करने के लिए, एक साधारण लाइन चार्ट या साइड-बाय-साइड बार तुलना सबसे उपयुक्त रहती है। इसका उद्देश्य परिवर्तन की दिशा को एक नज़र में स्पष्ट करना है।
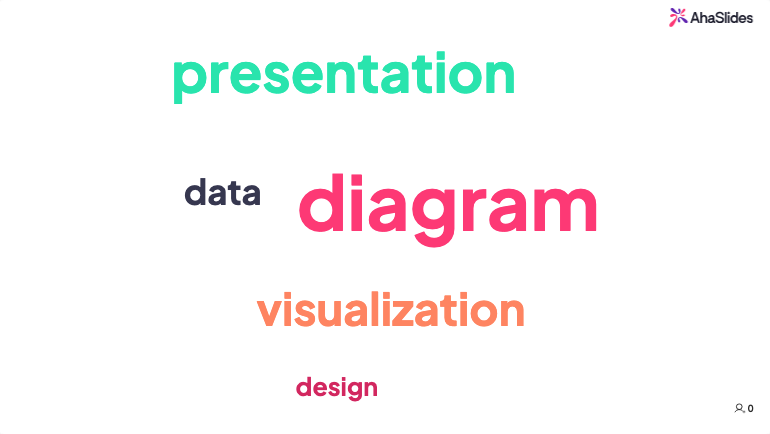
खुले सिरे वाले पाठ उत्तर इन्हें सीधे-सीधे उद्धरण के रूप में प्रस्तुत करना आवश्यक नहीं है (हालांकि कुछ चुनिंदा उद्धरण प्रभावशाली हो सकते हैं)। वर्ड क्लाउड सबसे अधिक उपयोग किए जाने वाले शब्दों को शीघ्रता से उजागर कर सकते हैं, जो बड़ी संख्या में प्रतिक्रियाओं में मुख्य विषयों को पहचानने में उपयोगी होता है।
सभी प्रकार के चार्टों के लिए एक ही नियम लागू होता है: चार्ट पर सीधे डेटा को लेबल करें, लेजेंड पर निर्भर न रहें। दर्शकों को यह समझने के लिए रंग कुंजी का सहारा लेने की आवश्यकता नहीं होनी चाहिए कि वे क्या देख रहे हैं।
चरण 4: सूची बनाने के बजाय एक कथा बनाएं
एक उपयोगी प्रस्तुति और एक भुला देने वाली प्रस्तुति के बीच का अंतर अक्सर इस बात पर निर्भर करता है कि प्रस्तुतकर्ता ने कहानी सुनाने की कोशिश की या केवल संख्याएँ बताईं [3]।
सर्वेक्षण परिणामों की कथात्मक संरचना आमतौर पर इस प्रकार दिखती है:
पृष्ठभूमि: सर्वेक्षण किस बारे में था, किसने जवाब दिया और यह कब आयोजित किया गया था? इसे एक स्लाइड या कुछ वाक्यों में ही बताएँ। दर्शकों को डेटा पर भरोसा करने के लिए पर्याप्त जानकारी चाहिए, पूरी कार्यप्रणाली रिपोर्ट नहीं।
मुख्य निष्कर्ष: सबसे महत्वपूर्ण परिणाम से शुरुआत करें। इसे एक कथन के रूप में प्रस्तुत करें, प्रश्न के रूप में नहीं। "62 प्रतिशत कर्मचारियों का कहना है कि उनके काम को प्रभावित करने वाले निर्णयों के बारे में उनके पास पर्याप्त जानकारी नहीं है" एक निष्कर्ष है। "कर्मचारी आंतरिक संचार के बारे में क्या सोचते हैं?" एक प्रश्न है, निष्कर्ष नहीं।
सहायक विवरण: दो या तीन ऐसे डेटा बिंदु जो मुख्य निष्कर्ष को और अधिक गहराई प्रदान करते हैं। चार्ट से भरपूर स्लाइडें यहीं उपयोगी साबित होती हैं।
तुलना या संदर्भ: यह पिछले सर्वेक्षण की अवधि, उद्योग के मानक या किसी अन्य टीम या विभाग से किस प्रकार भिन्न है? किसी संदर्भ में संख्याएँ अधिक सार्थक होती हैं।
निहितार्थ: व्यवहार में इस निष्कर्ष का क्या अर्थ है? यहीं पर आप डेटा को उन निर्णयों से जोड़ते हैं जो दर्शकों को लेने की आवश्यकता होती है।
सिफारिश: आगे क्या होना चाहिए? भले ही प्रस्तुतकर्ता के पास कोई अंतिम उत्तर न हो, प्रस्तुति का समापन स्पष्ट विकल्पों के साथ होना चाहिए, न कि दर्शकों को इसके निहितार्थों का स्वयं पता लगाने के लिए छोड़ देना चाहिए।
चरण 5: निष्कर्षों को व्यावसायिक लक्ष्यों से जोड़ें
संगठनात्मक प्राथमिकताओं से अलग हटकर प्राप्त सर्वेक्षण डेटा से शायद ही कभी कोई कार्रवाई प्रेरित होती है। यदि सर्वेक्षण प्रशिक्षण की प्रभावशीलता के बारे में था, तो निष्कर्षों को उन कौशल कमियों से जोड़ें जो प्रदर्शन या कर्मचारियों को बनाए रखने को प्रभावित करती हैं। यदि यह कर्मचारी सहभागिता के बारे में था, तो निष्कर्षों को कर्मचारियों के नौकरी छोड़ने के जोखिम या उत्पादकता संकेतकों से जोड़ें।
संगठन के लिए पहले से ही महत्वपूर्ण परिणामों के साथ डेटा को संरेखित करना कोई दिखावा नहीं है। यह संदर्भ प्रदान करता है। "वितरण विभाग के 38% कर्मचारी प्रशिक्षण से प्राप्त कौशल को अपने दैनिक कार्य में शायद ही कभी लागू करते हैं" यह निष्कर्ष, उसी विभाग के टर्नओवर डेटा के साथ प्रस्तुत किए जाने पर, अकेले प्रस्तुत किए जाने की तुलना में अधिक उपयोगी होता है।
चरण 6: प्रारूप और प्रस्तुति तय करें
आप परिणामों को कैसे साझा करते हैं, यह दर्शकों और निष्कर्षों की तात्कालिकता से मेल खाना चाहिए [4]।
जब निष्कर्ष महत्वपूर्ण हों, प्रश्न पूछे जाने की संभावना हो, या समूह के साथ वास्तविक समय में इसके निहितार्थों पर चर्चा करना हो, तो लाइव प्रस्तुति कारगर साबित होती है। लाइव प्रस्तुति से आप समूह की स्थिति को समझ सकते हैं और उसके अनुसार बदलाव कर सकते हैं। यदि कोई चार्ट लोगों को भ्रमित कर रहा है, तो आप उसे मौके पर ही स्पष्ट कर सकते हैं।
लिखित रिपोर्ट या साझा स्लाइड डेक उन श्रोताओं के लिए उपयोगी होते हैं जिन्हें अपनी गति से डेटा को समझना होता है या इसे उन लोगों के साथ साझा करना होता है जो मूल बैठक में उपस्थित नहीं थे। लाइव प्रस्तुति के बाद संदर्भ दस्तावेज़ के रूप में भी रिपोर्ट उपयोगी होती हैं।
नियमित रूप से चलने वाले प्रशिक्षण मूल्यांकन और सर्वेक्षणों के लिए, चल रहे परिणामों को दिखाने वाला डैशबोर्ड आवधिक रिपोर्ट की जगह पूरी तरह ले सकता है। टीमें निर्धारित समीक्षा की प्रतीक्षा किए बिना रुझानों की जानकारी प्राप्त कर सकती हैं।
लाइव सर्वेक्षण परिणाम प्रस्तुति के लिए AhaSlides का उपयोग करना
AhaSlides एक ऑल-इन-वन ऑडियंस एंगेजमेंट प्लेटफॉर्म है जो एक ही सेशन में पोल, रेटिंग स्केल, वर्ड क्लाउड, ओपन-एंडेड प्रश्न और प्रश्नोत्तर जैसी सुविधाओं को शामिल करता है। यह उन प्रशिक्षकों और फैसिलिटेटर्स के लिए उपयोगी है जो लाइव सेशन संचालित करते हैं। अहास्लाइड्स यह आपको सत्र के दौरान ही सर्वेक्षण के परिणाम वास्तविक समय में प्रस्तुत करने की सुविधा देता है। प्रतिभागियों के जवाब देते ही सर्वेक्षण के परिणाम, रेटिंग स्केल की प्रतिक्रियाएँ और वर्ड क्लाउड आउटपुट अपडेट हो जाते हैं, इसलिए आप ताज़ा जानकारी को ही प्रतिभागियों के साथ साझा कर सकते हैं, बजाय इसके कि परिणामों को संकलित करके कई दिनों बाद आने वाली रिपोर्ट में डालें।
यह प्रशिक्षण के बाद के मूल्यांकन के लिए विशेष रूप से उपयोगी है, जहाँ समूह के समग्र आत्मविश्वास स्कोर को देखने से सत्र के एक सप्ताह बाद की संक्षिप्त रिपोर्ट पढ़ने की तुलना में अधिक स्पष्ट चर्चा को बढ़ावा मिलता है। जब 60% प्रतिभागी किसी प्रमुख कौशल पर कम आत्मविश्वास दिखाते हैं और समापन चर्चा के दौरान यह डेटा स्क्रीन पर दिखाई देता है, तो आगे की प्रक्रिया बदल जाती है: प्रशिक्षक तुरंत कमी को दूर कर सकते हैं, और प्रतिभागी देख सकते हैं कि उन्हें जो कठिनाई हुई है, उसमें वे अकेले नहीं हैं।
AhaSlides सत्र समाप्त होने के बाद अधिक विस्तृत विश्लेषण के लिए प्रतिक्रियाओं को स्प्रेडशीट डेटा के रूप में निर्यात भी करता है, जिससे लाइव प्रस्तुति और सत्र के बाद की रिपोर्टिंग बिना किसी अतिरिक्त प्रक्रिया के एक ही डेटा से की जा सकती है। इसे एक संक्षिप्त रिपोर्ट की तरह कम और एक लाइव स्कोरबोर्ड की तरह अधिक समझें। जब लोग वास्तविक समय में आंकड़े देख पाते हैं तो उनकी प्रतिक्रिया अलग होती है।
आम गलतियों से बचने के लिए
हर प्रश्न प्रस्तुत करना। एक ही बैठक में श्रोता 25 डेटा बिंदुओं को आत्मसात नहीं कर सकते। इसलिए, जानकारी को सावधानीपूर्वक छाँटें। कम महत्वपूर्ण प्रश्नों को परिशिष्ट में रखें ताकि पूछे जाने पर डेटा उपलब्ध हो, लेकिन मुख्य प्रस्तुति को उन तीन से पाँच निष्कर्षों पर केंद्रित रखें जो वास्तव में श्रोताओं का ध्यान आकर्षित करने योग्य हों।
गलत चार्ट प्रकार का उपयोग करना। आठ स्लाइस वाला पाई चार्ट लोगों को कुछ नहीं बताता। पाँच प्रश्नों पर लाइकरट वितरण की तुलना करने वाला स्टैक्ड बार चार्ट उन्हें बहुत कुछ बताता है। किसी भी दृश्य को अंतिम रूप देने से पहले, यह पूछें कि क्या सर्वेक्षण से अपरिचित कोई सहकर्मी इसे दस सेकंड से कम समय में सही ढंग से समझ सकता है। यदि नहीं, तो इसे सरल बनाएं या प्रारूप बदलें।
"तो क्या हुआ" वाली बात को छोड़ देना। बिना व्याख्या के डेटा दर्शकों को अपने निष्कर्ष निकालने के लिए मजबूर करता है, जिसका अक्सर मतलब होता है कि वे कोई निष्कर्ष नहीं निकाल पाते। प्रत्येक निष्कर्ष के बाद एक वाक्य होना चाहिए जो यह बताए कि व्यावहारिक दृष्टि से यह क्यों महत्वपूर्ण है। यदि आप वह वाक्य नहीं लिख सकते, तो वह निष्कर्ष प्रस्तुति का हिस्सा नहीं होना चाहिए।
मुख्य खबर को दबा देना। 20 मिनट की प्रस्तुति की शुरुआत मुख्य निष्कर्ष पर पहुंचने से पहले पांच मिनट की कार्यप्रणाली पर चर्चा से करना, श्रोताओं का ध्यान भटकाने का एक पक्का तरीका है। स्लाइड दो या तीन पर सबसे महत्वपूर्ण परिणाम से शुरुआत करें, फिर बाद में उन लोगों के लिए संदर्भ और विवरण प्रदान करें जो इसे जानना चाहते हैं।
विवरण का स्तर गलत है। नेतृत्व टीम को सर्वेक्षण तैयार करने वाली टीम से अलग डेटा की आवश्यकता होती है। संदेह होने पर, एक संक्षिप्त संस्करण तैयार करें और अधिक विस्तृत बैकअप तैयार रखें ताकि चर्चा आगे बढ़ने पर उसका उपयोग किया जा सके।
ज़्यादातर पूछे जाने वाले सवाल
सर्वेक्षण के परिणामों की प्रस्तुति कितनी लंबी होनी चाहिए?
अधिकांश नेतृत्वकर्ताओं या हितधारकों के लिए, 15 से 20 मिनट का समय उपयुक्त होता है। आमतौर पर इतने समय में तीन से पाँच मुख्य निष्कर्षों को शामिल किया जा सकता है, प्रत्येक के लिए प्रासंगिक संदर्भ प्रदान किया जा सकता है और अंत में सुझाव दिए जा सकते हैं। यदि निष्कर्ष जटिल हैं या श्रोता विस्तृत जानकारी चाहते हैं, तो 30 मिनट की समय सीमा उचित है। इससे अधिक समय को कार्यशाला या कार्य सत्र के रूप में आयोजित किया जाना चाहिए, न कि प्रस्तुति के रूप में।
परिशिष्ट में क्या-क्या शामिल होना चाहिए?
मुख्य प्रस्तुति से हटाई गई हर वो चीज़ शामिल करें जिसके बारे में कोई जिज्ञासु हितधारक पूछ सकता है: प्रश्न-दर-प्रश्न पूर्ण विवरण, जनसांख्यिकीय विभाजन, खुले प्रश्नों के शब्दशः उत्तर और कार्यप्रणाली संबंधी कोई भी टिप्पणी। परिशिष्ट मुख्य प्रस्तुति को छोटा करता है, लेकिन अंतर्निहित डेटा को अनुपलब्ध नहीं होने देता।
यदि निष्कर्ष निराशाजनक हों तो आप उन्हें कैसे प्रस्तुत करेंगे?
डेटा को सटीक रूप से प्रस्तुत करें और उसे संदर्भ के साथ जोड़ें। यदि सहभागिता स्कोर में उल्लेखनीय गिरावट आई है, तो इसका स्पष्ट रूप से उल्लेख करें, इसमें योगदान देने वाले संभावित कारकों को शामिल करें और प्रस्तावित समाधान के साथ तैयार रहें। दर्शक आमतौर पर स्पष्ट योजना के साथ दिए गए ईमानदार निष्कर्षों पर बेहतर प्रतिक्रिया देते हैं, बजाय इसके कि अस्पष्ट परिणामों को अनदेखा कर दिया जाए।
सूत्रों का कहना है
[1] अल्केमर. पाई चार्ट या बार ग्राफ? सर्वेक्षण के परिणाम प्रस्तुत करना। https://www.alchemer.com/resources/blog/pie-chart-or-bar-graph/
[2] फलना-फूलना. सर्वेक्षण के जवाबों को प्रभावी ढंग से देखने के 5 तरीके। https://flourish.studio/blog/visualizing-survey-data/
[3] वेनगेज. सर्वेक्षण परिणामों को प्रभावी ढंग से कैसे प्रस्तुत करें। https://venngage.com/blog/survey-results/
[4] इनसाइट7. हितधारकों को सर्वेक्षण डेटा प्रस्तुत करने के शीर्ष तरीके। https://insight7.io/top-methods-for-presenting-survey-data-to-stakeholders/
[5] मैककिन्से ग्लोबल इंस्टीट्यूट. विश्लेषण का युग: डेटा-संचालित दुनिया में प्रतिस्पर्धा करना। https://www.mckinsey.com/capabilities/quantumblack/our-insights/the-age-of-analytics-competing-in-a-data-driven-world