Մենք փնտրում ենք արդյունավետ համակարգ ստեղծելու նոր եղանակ հարցման արդյունքների ներկայացում? Ստուգեք լավագույն ուղեցույցը 4 քայլերով AhaSlides-ի հետ:
Երբ խոսքը վերաբերում է հետազոտության արդյունքների ներկայացմանը, մարդիկ մտածում են հետազոտության բոլոր արդյունքները միավորել ppt-ի մեջ և այն ներկայացնել իրենց ղեկավարին:
Այնուամենայնիվ, հարցման արդյունքները ձեր ղեկավարին հաղորդելը կարող է մարտահրավերային խնդիր լինել, այն սկսվում է հարցման դիզայնից, հարցման նպատակների հասկացումից, թե ինչ պետք է թաքցնեք, որոնք են կարևոր արդյունքները, կամ անտեղի և մանրուքների վերաբերյալ կարծիքները ֆիլտրելուց և դրանք սահմանափակ ժամանակահատվածում ներկայացնելուց՝ ներկայացման համար։
Ողջ գործընթացը բավականին ժամանակ և ջանք է խլում, բայց կա խնդրին հաղթահարելու միջոց. հասկանալով հարցման էությունը և հետազոտության արդյունքների ներկայացումը, դուք բացարձակապես կարող եք տպավորիչ ներկայացում մատուցել ձեր ղեկավարության վերին մակարդակին:
Բառը
- Ի՞նչ է հարցման արդյունքների ներկայացումը
- Հարցման արդյունքների ներկայացում ունենալու առավելությունները
- Ինչպե՞ս կազմակերպել հարցման արդյունքների ներկայացումը։
- #1 Կենտրոնացեք թվերի վրա
- #2 Տեսողական տարրերի օգտագործումը
- #3 Որակական տվյալների վերլուծություն
- #4 Օգտագործեք ինտերակտիվ հարցման գործիք
- Լավագույն հարցման հարցերը
- The Bottom Line
- Հաճախակի տրվող հարցեր

Խորհուրդներ ավելի լավ ներգրավվածության համար
Ի՞նչ է հարցման արդյունքների ներկայացումը:
Բառացիորեն, հարցման արդյունքների ներկայացումը հարցման արդյունքները տեսողականորեն նկարագրելու միջոց է, որպեսզի ավելի խորը պատկերացում կազմվի թեմայի մասին: Այն կարող է լինել աշխատակիցների գոհունակության հարցման, հաճախորդների գոհունակության հարցման, վերապատրաստման և դասընթացների գնահատման հարցման, շուկայի հետազոտության և այլնի արդյունքների և քննարկման PPT զեկույց:
Հարցման թեմաների և ներկայացման հարցման հարցերի սահմանափակում չկա:
Յուրաքանչյուր հարցում կունենա նպատակ, որին պետք է հասնել, և հարցման արդյունքների ներկայացումը վերջին քայլն է գնահատելու, թե արդյոք այս նպատակները ձեռք են բերվել, և թե կազմակերպությունը կարող է սովորել և բարելավել այդ արդյունքներից:
Հարցման արդյունքների ներկայացման առավելությունները
Չնայած ձեր ղեկավարը և գործընկերները կարող են հեշտությամբ ներբեռնել կամ տպել հարցման հաշվետվությունները PDF ֆորմատով, անհրաժեշտ է ունենալ շնորհանդես, քանի որ նրանցից շատերը բավարար ժամանակ չունեն հարյուրավոր բառերով լի էջեր կարդալու համար։
Հարցման արդյունքների ներկայացումը օգտակար է, քանի որ այն կարող է օգնել մարդկանց արագ ստանալ օգտակար տեղեկատվություն հարցման արդյունքների մասին, թիմերին տրամադրել համատեղ ժամանակ՝ հարցման ընթացքում խնդիրը քննարկելու և լուծելու համար, կամ ավելի լավ որոշումներ կայացնել և գործողություններ կատարել:
Ավելին, հարցման արդյունքների ներկայացման դիզայնը՝ գրաֆիկայով, կետերով և պատկերներով, կարող է գրավել լսարանի ուշադրությունը և հետևում է ներկայացման տրամաբանությանը: Ավելի ճկուն է թարմացնել և խմբագրել նույնիսկ ներկայացման ընթացքում, երբ ցանկանում եք նշել ձեր ղեկավարների գաղափարներն ու կարծիքները:
🎉 Հեշտ օգտագործման համար գաղափարների տախտակ կարծիքներն ավելի լավ կազմակերպելու համար։

Ինչպե՞ս ստեղծել հարցման արդյունքների ներկայացում:
Ինչպե՞ս ներկայացնել հարցման արդյունքները հաշվետվության մեջ: Այս մասում ձեզ կտրվեն մի քանի լավագույն խորհուրդներ հարցման արդյունքների ներկայացում կատարելու համար, որպեսզի բոլորը ճանաչեն և գնահատեն ձեր աշխատանքը: Բայց նախքան դա, համոզվեք, որ գիտեք ակադեմիական հարցումների և բիզնես հարցումների միջև եղած տարբերությունը, որպեսզի իմանաք, թե ինչն է կարևոր ասել, ինչ է ուզում իմանալ ձեր լսարանը և այլն:
- Կենտրոնացեք թվերի վրա
Թվերը համեմատեք համատեքստում, օրինակ՝ արդյոք «15 տոկոսը» շատ է, թե քիչ ձեր համատեքստում՝ օգտագործելով համապատասխան համեմատություն: Եվ, եթե հնարավոր է, կլորացրեք ձեր թիվը: Քանի որ ձեր լսարանի համար, հավանաբար, պարտադիր չէ իմանալ, թե ձեր աճը 20.17% է, թե 20%՝ ներկայացման առումով, և կլորացված թվերը շատ ավելի հեշտ է անգիր անել:
- Օգտագործելով տեսողական տարրեր
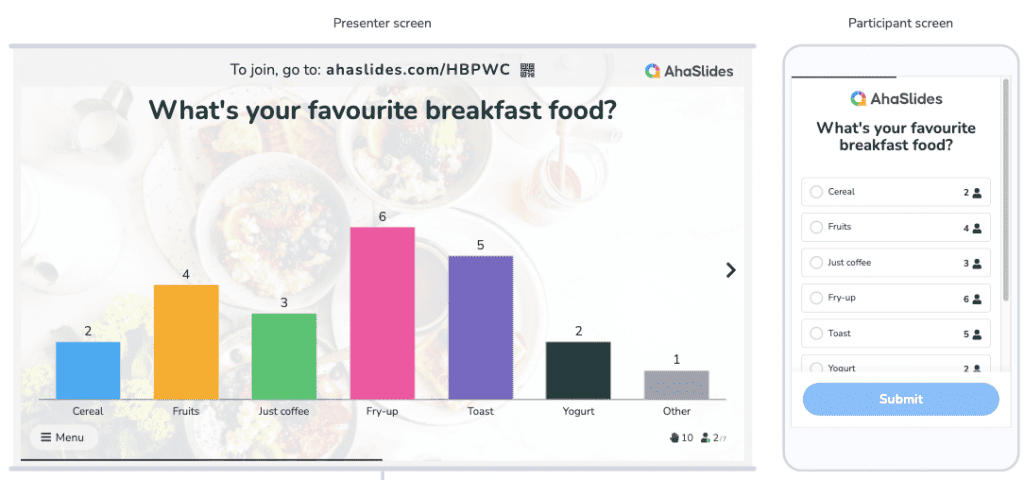
Թիվը կարող է նյարդայնացնող լինել, եթե մարդիկ չեն կարողանում հասկանալ դրանց հետևում թաքնված պատմությունը: Դիագրամները, գրաֆիկները և նկարազարդումները… շնորհանդեսում տվյալները արդյունավետորեն ներկայացնելու ամենակարևոր մասն են, հատկապես հարցման արդյունքները ներկայացնելու համար: Դիագրամ կամ գրաֆիկ կառուցելիս արդյունքները դարձրեք հնարավորինս հեշտ ընթեռնելի: Սահմանափակեք տողերի հատվածների և տեքստի այլընտրանքների քանակը:
- Որակական տվյալների վերլուծություն
Իդեալական հարցումը կհավաքի և՛ քանակական, և՛ որակական տվյալներ: Արդյունքների մանրամասն ուսումնասիրությունը կարևոր է լսարանի համար՝ խնդրի արմատը հասկանալու համար: Սակայն, ինչպես արդյունավետորեն փոխակերպել և մեկնաբանել որակական տվյալները՝ առանց կորցնելու դրանց սկզբնական իմաստը, միևնույն ժամանակ խուսափելով ձանձրալիությունից:
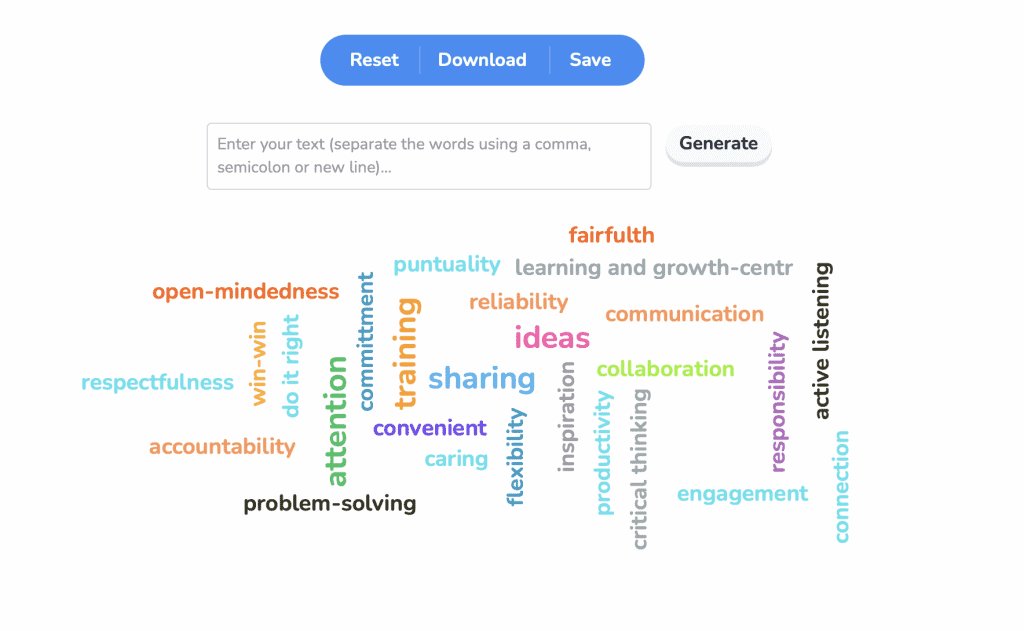
Երբ ցանկանում եք կենտրոնանալ տեքստերով բաց պատասխանները լուսաբանելու վրա, կարող եք հաշվի առնել տեքստի վերլուծությունը՝ դա ձեզ հնարավորություն տալու համար: Երբ հիմնաբառեր եք դնում ա Բառի ամպ, ձեր լսարանը կարող է արագորեն ընկալել կարևոր կետեր, որոնք կարող են նպաստել նորարարական գաղափարների ստեղծմանը։
- Օգտագործեք ինտերակտիվ հարցման գործիք
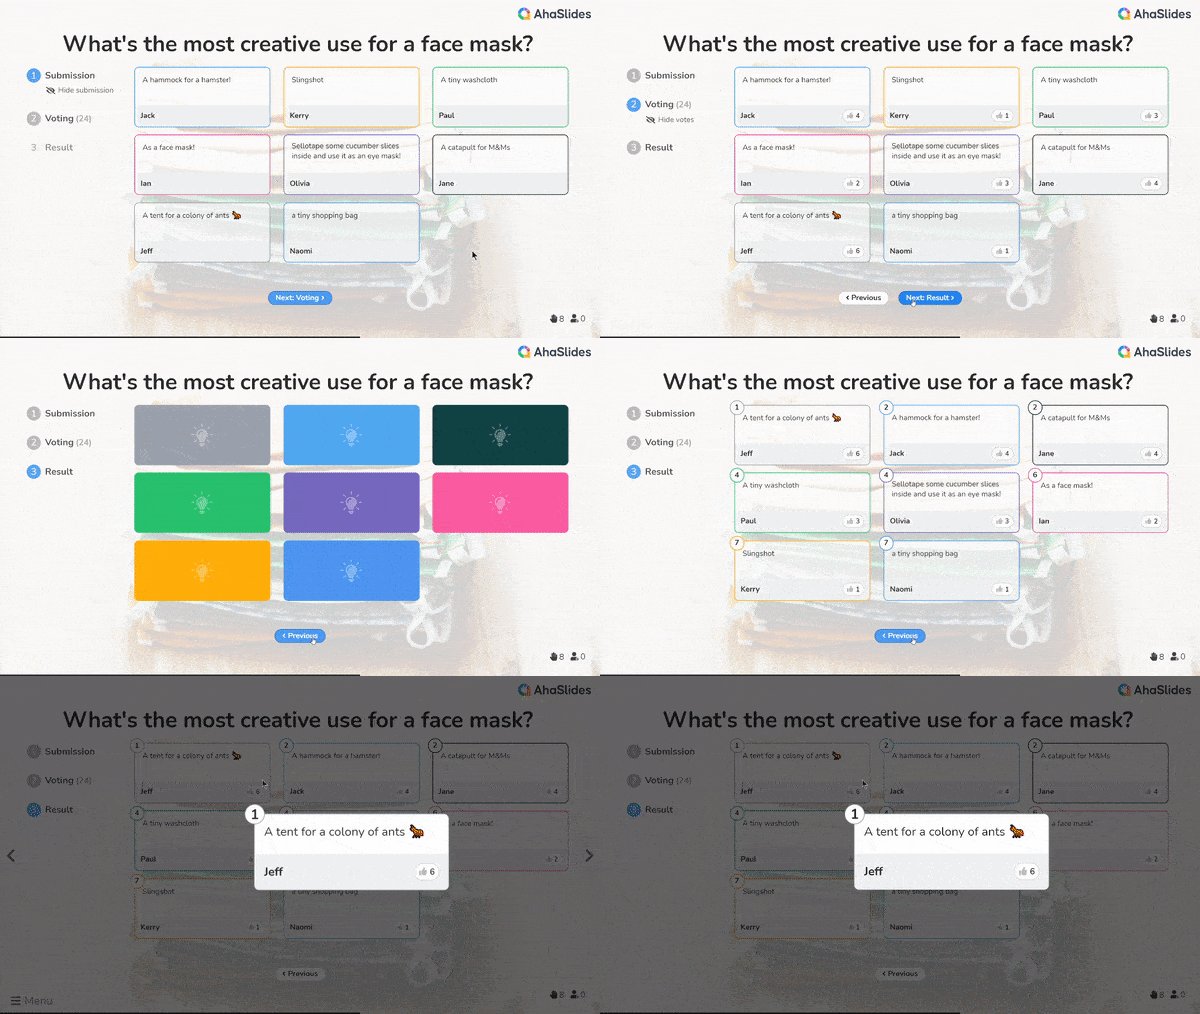
Որքա՞ն ժամանակ է պահանջվում հարցում ստեղծելու, տվյալներ հավաքելու, վերլուծելու և ավանդաբար հաշվետվություններ ներկայացնելու համար։ Ինչո՞ւ չօգտագործել ինտերակտիվ հարցում նվազեցնել ձեր ծանրաբեռնվածությունը և բարձրացնել արտադրողականությունը: Հետ AhaSlides- ը, Դուք կարող եք հարմարեցնել հարցումները, և տարբեր տեսակի հարցեր, ինչպիսիք են մանող անիվ, վարկանիշային սանդղակ, առցանց վիկտորինայի ստեղծող, բառերի ամպեր, կենդանի հարցուպատասխան,… արդյունքների իրական ժամանակի տվյալների թարմացումներով: Դուք կարող եք նաև մուտք գործել նրանց արդյունքների վերլուծություններին՝ կենդանի սյունակային, գրաֆիկական, գծային…
Հարցման հարցեր հարցման արդյունքների ներկայացման համար
- Ի՞նչ տեսակի սնունդ եք ուզում ունենալ ընկերության ճաշարանում։
- Ձեր ղեկավարը կամ աշխատանքի վայրում ինչ-որ մեկը, կարծես թե, հոգ է տանում ձեր մասին, երբ դուք դժվարության եք հանդիպում:
- Ո՞րն է ձեր աշխատանքի լավագույն մասը:
- Որո՞նք են ձեր սիրելի ընկերությունների ուղևորությունները:
- Արդյո՞ք մենեջերները մատչելի և արդար են վերաբերվում:
- Ընկերության որ մասն եք կարծում, որ այն պետք է բարելավվի։
- Ձեզ դուր է գալիս մասնակցել ընկերության ներսում անցկացվող վերապատրաստմանը։
- Ձեզ դուր է գալիս թիմային գործունեությունը:
- Ո՞րն է Ձեր նպատակը Ձեր կարիերայում առաջիկա 5 տարիներին:
- Ցանկանու՞մ եք պարտավորվել ընկերությանը մոտակա 5 տարում:
- Գիտե՞ք արդյոք մեր ընկերությունում որևէ մեկի, ով ոտնձգության զոհ է դարձել։
- Դուք հավատու՞մ եք, որ ընկերության ներսում կա անձնական կարիերայի աճի և զարգացման հավասար հնարավորություն:
- Արդյո՞ք ձեր թիմը ձեզ համար մոտիվացիայի աղբյուր է աշխատանքում լավագույնս անելու համար:
- Ո՞ր կենսաթոշակային փոխհատուցման պլանն եք նախընտրում:

Սկսեք վայրկյանների ընթացքում:
Փնտրու՞մ եք հարցման արդյունքների ներկայացման ձևանմուշներ: Գրանցվեք անվճար և վերցրեք այն, ինչ ցանկանում եք կաղապարների գրադարանից:
🚀 Դեպի ամպեր ☁️
Ref: պրեզոնո
The Bottom Line
Մեծ սխալ է թույլ տալ, որ տվյալները խոսեն ինքնին, քանի որ հարցման արդյունքների ներկայացումը ղեկավարներին պահանջում է ավելին, քան դա: Օգտագործելով վերը նշված խորհուրդները և աշխատել նման գործընկերոջ հետ AhaSlides- ը կարող է օգնել ձեզ խնայել ժամանակը, մարդկային ռեսուրսները և բյուջեն՝ ստեղծելով տվյալների վիզուալիզացիա և ամփոփելով հիմնական կետերը:
Պատրաստվեք ներկայացնել ձեր արդյունքները։ Գրանցվեք AhaSlides- ը անմիջապես ուսումնասիրել հետազոտության արդյունքների լավագույն ներկայացումը կատարելու վեհ միջոց:
Հաճախակի տրվող հարցեր
Հարց ունե՞ք։ Մենք պատասխաններ ունենք։

