
ほとんどの調査データはどこにも活用されない。 アンケートを実施する数字を集計し、すべての質問とその割合の内訳を一覧にしたアンケート結果のプレゼンテーションを作成する。関係者は会議中うなずき、資料は保管され、何も変わらない。聞き覚えのある話ではないだろうか?
問題はデータにあることはほとんどなく、プレゼンテーションにある。このガイドでは、調査結果がアーカイブフォルダを埋めるのではなく、意思決定を促すように、調査結果を構造化、視覚化、および提供する方法について解説する。マッキンゼー・グローバル・インスティテュートのレポートによると、データ主導型の組織は顧客獲得の可能性が23倍高く、収益性も19倍高いが、ほとんどの調査結果は明確なストーリーなしに提示されるため、意思決定に結びつかない[5]。
調査結果のプレゼンテーションが実際に果たすべき役割とは
グラフの種類を選択したり、タイトルスライドを作成したりする前に、プレゼンテーションが果たすべき役割を明確にしましょう。調査結果のプレゼンテーションには、次の3つの役割があります。
- 聴衆にあなたが発見したことを伝えてください
- なぜそれが彼らにとって特に重要なのかを説明する
- 次に何が起こるべきかを指摘してください。
それ以外のものは全て装飾です。 従業員の関与 データは方法論を検証するためのものではありません。彼らが知りたいのは、数字が組織の現状について何を物語っているのか、そして何を変えるべきなのかということです。研修評価結果をレビューする人事担当者は、どのプログラムが効果的で、どのプログラムを再設計する必要があるのかを知りたいのです。最初のスライドを見せる前から、枠組みが重要なのです。
ステップ1:何かを作る前に、ターゲットとなるユーザー層を把握する
同じ調査データでも、その場にいる人によってパッケージ化の仕方を変える必要がある。詳細な内訳は リッカート尺度 10個の質問に分散して回答してもらうのは、人事アナリストのチームには適切です。しかし、CFOに提示する同じ情報は、ビジネス成果に直接結びつく2つか3つの主要な調査結果に凝縮する必要があります。
プレゼンテーション資料やレポートを作成する前に、以下の質問に答えてください。
- この聴衆はどのような決断を下す必要があるのか?
- 彼らは調査とその目的について、どの程度の背景情報を既に把握しているのだろうか?
- 彼らには、プレゼンテーションを事前に確認したり、最後まで視聴したりするのにどれくらいの時間が与えられるのでしょうか?
- どの程度の統計情報が彼らにとって有用で、どの程度の情報量が多すぎると感じるだろうか?
経営陣向けのプレゼンテーションでは、最も重要な発見を最初に提示しましょう。実務担当者向けのプレゼンテーションでは、より詳細な情報を段階的に盛り込んでも構いません。様々な立場の人が参加する場では、主要な発見を最初に提示し、それを裏付けるデータを後から示すように構成しましょう。そうすることで、関係者は重要なポイントを理解した時点で退席でき、分析チームは残りの内容を聞くことができます。
ステップ2:データを視覚化する前にフィルタリングする
30問のアンケート調査では30個のデータポイントが得られますが、だからといってその30個すべてを提示する必要はありません。ほとんどのアンケート調査では、実際に意思決定に役立つ知見は3~5個程度です。残りはせいぜい背景情報、最悪の場合はノイズに過ぎません。
結果を精査し、どの発見が驚くべきものか、重要なものか、あるいは行動に移せるものかを考えてみましょう。回答者の94%が同じ回答をした質問は、ほとんど役に立たないため、削除しても問題ないでしょう。一方、部門によって回答が大きく分かれる質問や、前回の調査サイクル以降、傾向が大きく変化した質問は、通常、プレゼンテーションに含めるべきです。
このフィルタリングの段階こそ、多くのプレゼンターが力を入れていない部分です。すべてを見せることは徹底しているように思えるかもしれませんが、それは教科書のすべての行にマーカーを引くようなものです。すべてが重要だとマークされていると、結局何も重要ではなくなるのです。
ステップ3:データに合ったグラフの種類を選択する
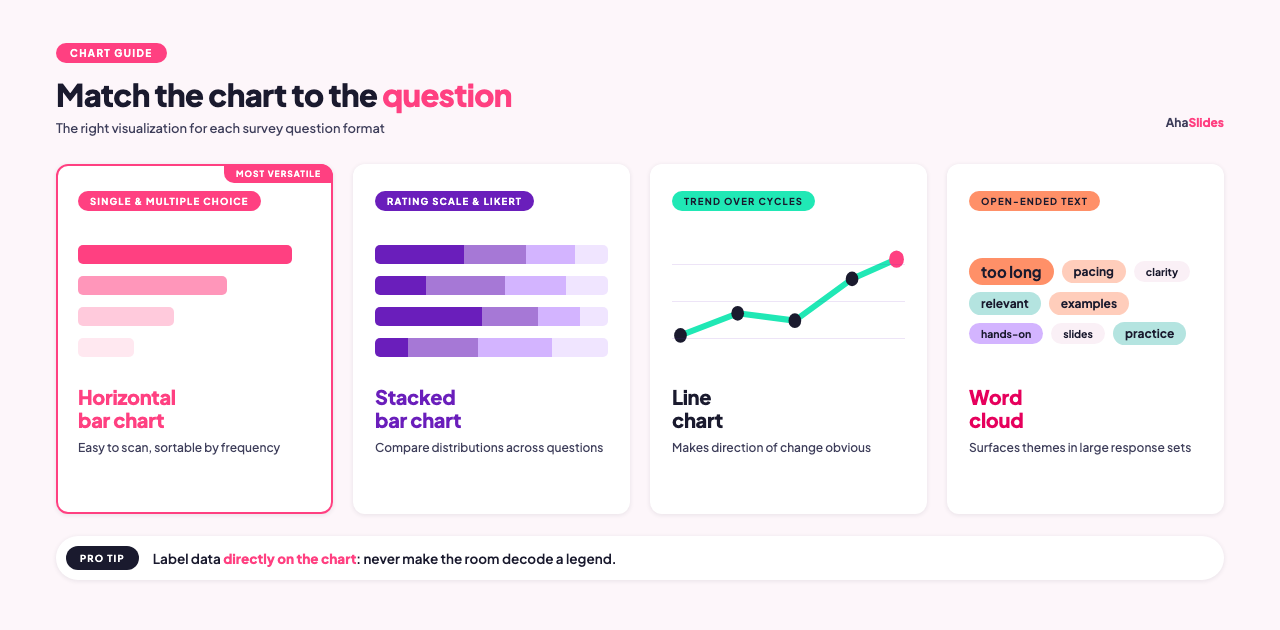
質問形式が異なれば、適切な視覚化方法も異なります。間違ったグラフの種類を使用すると、正確なデータでも理解しにくくなります。
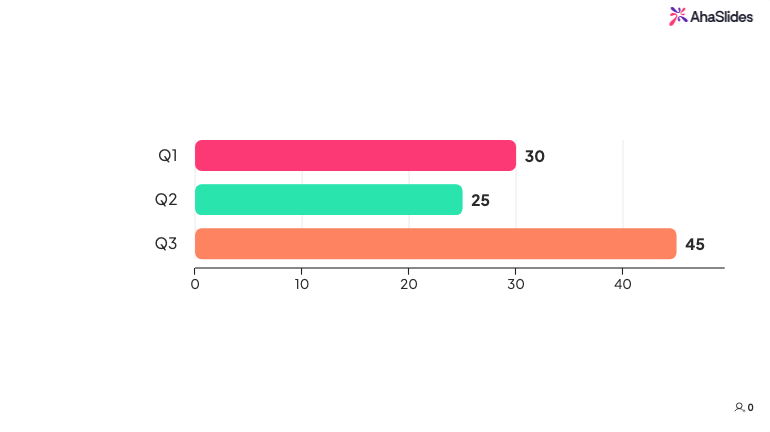
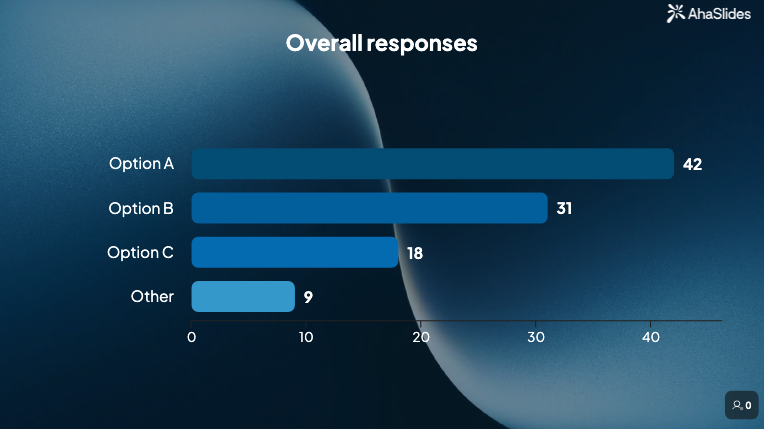
単一選択式問題と複数選択式問題 横棒グラフはうまく機能します。棒グラフはスキャンしやすく、カテゴリの数に関係なく処理でき、回答を頻度で並べ替えることができるため、パターンがすぐにわかります[1]。円グラフは、全体に対する割合が主なポイントとなる、4つ以下の選択肢がある単一選択の質問には適していますが、5つ以上のスライスがあると読みにくくなります。
評価尺度とリッカート尺度の質問 回答は積み上げ棒グラフで表示するのが最適です。各棒は1つの質問を表し、セグメントは尺度全体にわたる回答の分布を示します[2]。これにより、1つのビジュアルで複数の質問に対する回答パターンを比較できます。
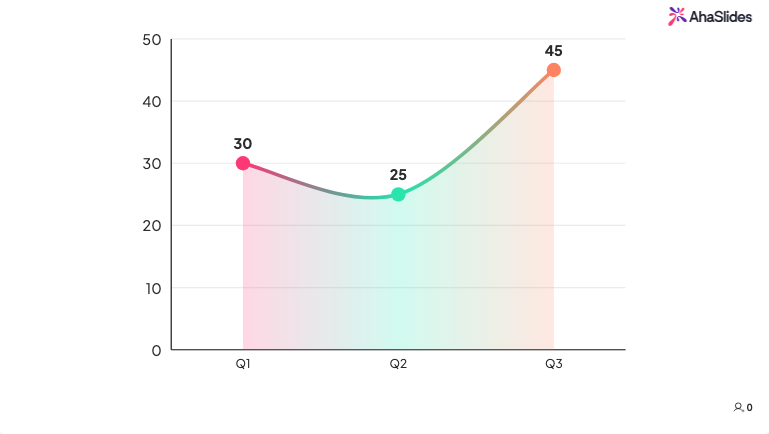
トレンドデータ今回のサイクルと前回のサイクルの結果を比較する場合、シンプルな折れ線グラフや並列棒グラフが最も効果的です。目的は、変化の方向性を一目で明確にすることです。
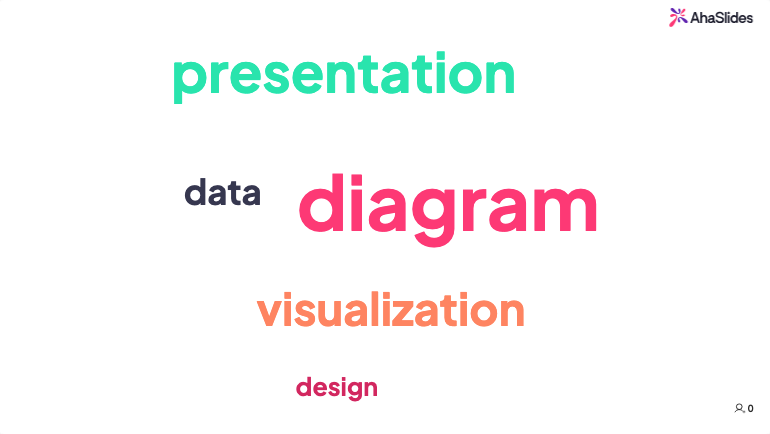
自由記述式の回答 引用文をそのまま提示する必要はありません(ただし、厳選された引用文は効果的です)。ワードクラウドを使えば、最も頻繁に使用されている用語を素早く把握できるため、大量の回答の中からテーマを見つけるのに役立ちます。
あらゆるグラフの種類に共通するルールが一つあります。それは、凡例に頼るのではなく、グラフ上にデータを直接ラベル付けすることです。グラフを見る人が、何を見ているのかを理解するために、色の凡例を参照する必要があってはなりません。
ステップ4:リストではなく、物語を構築する
有益なプレゼンテーションと忘れ去られるプレゼンテーションの違いは、プレゼンターがストーリーを伝えようとしたか、それとも単に数字を報告したかに大きく左右されることが多い[3]。
調査結果の記述構造は、一般的に以下のようになります。
コンテキスト: 調査内容、回答者、実施時期について説明してください。スライド1枚、または数文程度にまとめてください。聴衆はデータへの信頼感を抱くのに十分な情報を必要としており、詳細な調査方法論の報告書は必要ありません。
主な発見: 最も重要な結果から始めましょう。質問ではなく、断定的な表現で提示してください。「従業員の62%が、自分の仕事に影響を与える決定について十分な情報を得ていないと答えている」は調査結果です。「従業員は社内コミュニケーションについてどう考えているか?」は質問であり、調査結果ではありません。
補足情報: 見出しの調査結果に深みを与える2つか3つのデータポイント。こうした場面で、グラフを多用したスライドが真価を発揮する。
比較または文脈: これは、前回の調査期間、業界ベンチマーク、あるいは別のチームや部署と比較してどうでしょうか?数字は、何らかの基準との比較によってより意味を持ちます。
含意: この発見は実際にはどのような意味を持つのでしょうか?ここで、データと、視聴者が下さなければならない意思決定を結びつけることが重要になります。
推奨事項: 次に何が起こるべきでしょうか?たとえ発表者が最終的な答えを持っていなかったとしても、聴衆にその意味を自分で考えさせるのではなく、明確な選択肢を提示してプレゼンテーションを締めくくるべきです。
ステップ5:調査結果をビジネス目標に結びつける
組織の優先事項から切り離された調査データは、行動を促すことはほとんどない。調査が研修効果に関するものであれば、その結果を業績や定着率に影響を与えるスキルギャップと結びつけるべきだ。従業員のエンゲージメントに関するものであれば、その結果を離職リスクや生産性指標と結びつけるべきだ。
組織が既に重視している成果にデータを合わせることは、ごまかしではなく、文脈を示すことです。「流通部門の従業員の38%は、研修で得たスキルを日々の業務にほとんど活用していない」という調査結果は、単独で提示されるよりも、同じ部門の離職率データと組み合わせることで、より具体的な行動につながるものとなります。
ステップ6:フォーマットと配信方法を決定する
結果の共有方法は、対象者と調査結果の緊急性に合致している必要があります[4]。
ライブプレゼンテーションは、重要な発見があった場合、質問が予想される場合、またはグループとリアルタイムでその影響について議論したい場合に効果的です。ライブ配信では、会場の雰囲気を読み取り、状況に応じて対応できます。例えば、グラフが分かりにくい場合は、その場で説明を加えることができます。
書面による報告書や共有スライドは、各自のペースでデータを理解したい人や、元の会議に参加していなかった人と情報を共有したい人に適しています。また、報告書は、ライブプレゼンテーション後の参考資料としても役立ちます。
定期的に実施される研修評価や状況調査については、実施中の結果を表示するダッシュボードを使用することで、定期的な資料を完全に置き換えることができます。チームは、予定されたレビューを待つことなく、傾向を把握できます。
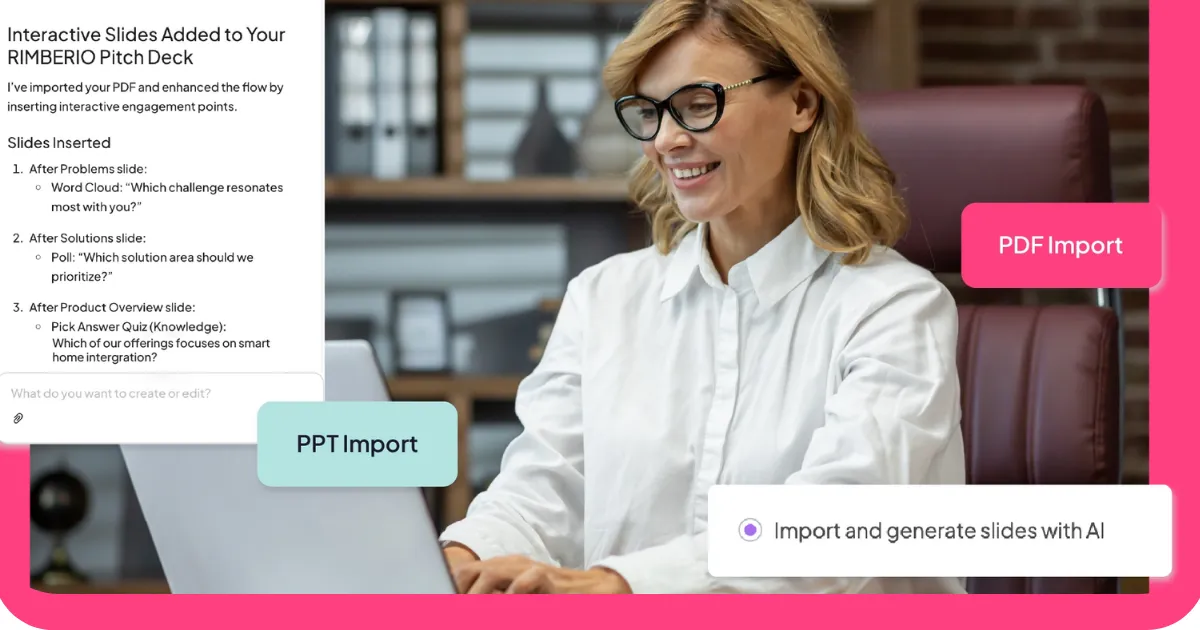
AhaSlidesを使用してアンケート結果をリアルタイムでプレゼンテーションする
AhaSlides は、アンケート、評価尺度、ワードクラウド、自由回答形式の質問、Q&A を 1 つのセッションで網羅するオールインワンのオーディエンス エンゲージメント プラットフォームです。ライブ セッションを実施するトレーナーやファシリテーター向けです。 あはスライド この機能を使えば、セッション中にリアルタイムでアンケート結果を提示できます。アンケート結果、評価尺度の回答、ワードクラウドの出力は参加者の回答に合わせて更新されるため、数日後に結果をまとめてレポートとして提出するのではなく、内容が新鮮なうちに調査結果を参加者全員と共有できます。
これは特に研修後の評価に役立ちます。グループ全体の自信度スコアを見ることで、研修から1週間後に事後報告を読むよりも、より率直な議論が生まれることが多いからです。参加者の60%が重要なスキルに自信がないと回答し、そのデータが最終ディスカッション中に画面に表示されると、その後の展開が変わります。トレーナーはすぐにそのギャップに対処でき、参加者は自分が困難を感じた点について、自分だけではないと気づくことができるのです。
AhaSlidesは、セッション終了後に詳細な分析を行うために、回答をスプレッドシートデータとしてエクスポートします。そのため、ライブプレゼンテーションとセッション後のレポート作成は、追加の手順なしで同じデータに基づいて行われます。これは、単なる振り返りレポートというより、リアルタイムのスコアボードのようなものだと考えてください。数字をリアルタイムで見ることができると、人々の反応は変わります。
よくある間違いは避けるために
すべての質問を提示します。 聴衆は1回の会議で25ものデータポイントを吸収することはできません。徹底的に厳選しましょう。重要度の低い質問は付録に移し、質問があった場合にデータを提供できるようにしつつ、メインのプレゼンテーションでは、聴衆の注目に値する3~5つの調査結果に焦点を絞りましょう。
間違ったグラフの種類を使用しています。 8つのスライスからなる円グラフは、何も伝えきれません。一方、5つの質問に対するリッカート尺度の分布を比較した積み上げ棒グラフは、多くの情報を伝えます。最終的なグラフを作成する前に、調査内容に不慣れな同僚が10秒以内に正しく解釈できるかどうかを確認してください。もしできない場合は、簡略化するか、形式を変更しましょう。
「だから何?」という問いは無視する。 解釈のないデータは、聴衆に独自の結論を導き出させることになりますが、多くの場合、結論は得られません。すべての調査結果には、それが実務上なぜ重要なのかを説明する一文を添えるべきです。もしその一文を書くことができないのであれば、その調査結果はプレゼンテーションに含めるべきではないかもしれません。
見出しを埋もれさせる。 20分間のプレゼンテーションで、主要な結果にたどり着く前に5分間も方法論の説明をするのは、聴衆の関心を失わせる確実な方法です。最も重要な結果を2枚目か3枚目のスライドで最初に提示し、その後、希望者向けに背景情報や詳細を説明するようにしましょう。
詳細レベルが適切でない。 経営陣は、調査を設計したチームとは異なるバージョンのデータを必要とします。迷った場合は、要約版を用意し、議論が深まる場合に備えて、より詳細なバックアップ資料も用意しておきましょう。
よくある質問
調査結果のプレゼンテーションはどのくらいの長さにするべきでしょうか?
ほとんどの経営陣や関係者を対象とする場合、15分から20分が目安となります。通常、この時間があれば、3~5つの重要な調査結果を取り上げ、それぞれの背景情報を提供し、最後に提言を述べるのに十分です。調査結果が複雑な場合や、聴衆が詳細な説明を期待している場合は、30分が妥当な上限でしょう。それ以上の時間を要する場合は、プレゼンテーションではなく、ワークショップやワークセッションの形式で行うべきです。
付録には何を入れるべきか?
メインプレゼンテーションから削除したものの、関心のある関係者が質問する可能性のある内容はすべて含めてください。具体的には、質問ごとの詳細な内訳、人口統計学的内訳、自由回答形式の回答の逐語録、および方法論に関する注記などです。付録によってメインプレゼンテーションの内容を簡潔にしつつ、基となるデータへのアクセス性を損なうことはありません。
調査結果が好ましくない場合、どのように結果を提示すればよいでしょうか?
データは正確に報告し、文脈を添えてください。エンゲージメントスコアが大幅に低下した場合は、その旨を明確に述べ、影響した可能性のある要因をすべて含め、対策案を用意しておきましょう。一般的に、視聴者は、本当の問題点を曖昧にしたまま結果を曖昧にするよりも、明確な計画を伴う正直な調査結果の方に好反応を示します。
ソース
[1] アルケマー。 円グラフか棒グラフか?アンケート結果の提示方法。 https://www.alchemer.com/resources/blog/pie-chart-or-bar-graph/
[2] 繁栄する。 アンケート回答を効果的に視覚化する5つの方法。 https://flourish.studio/blog/visualizing-survey-data/
[3] 復讐。 調査結果を効果的に提示する方法。 https://venngage.com/blog/survey-results/
[4] インサイト7。 調査データを関係者に提示するための最適な方法。 https://insight7.io/top-methods-for-presenting-survey-data-to-stakeholders/
[5] マッキンゼー・グローバル・インスティテュート。 分析の時代:データ主導の世界で競争する。 https://www.mckinsey.com/capabilities/quantumblack/our-insights/the-age-of-analytics-competing-in-a-data-driven-world