

大多數調查數據都石沉大海。團隊 運行調查總結數據,然後製作一份調查結果演示文稿,列出每個問題及其百分比組成。利害關係人在會議上點頭表示同意,簡報被束之高閣,一切照舊。聽起來是不是很熟悉?
問題很少出在數據本身,而在於呈現方式。本指南將介紹如何建構、視覺化和呈現調查結果,使調查結果能夠驅動決策,而不是淪為存檔文件。麥肯錫全球研究院的一份報告指出,數據驅動型組織獲取客戶的可能性是其他組織的23倍,盈利的可能性是其他組織的19倍,然而大多數調查結果卻未能轉化為決策,原因在於它們缺乏清晰的敘述[5]。
調查結果簡報真正需要做什麼
在選擇圖表類型或撰寫標題投影片之前,請先明確簡報需要完成的任務。調查結果簡報需要完成以下三件事:
- 告訴觀眾你的發現
- 解釋為什麼這對他們來說很重要。
- 指出接下來應該發生什麼
其他一切都是裝飾。高管們正在聽演示。 員工敬業度 數據並非用於審查方法論。他們想知道的是,這些數字反映了組織的現狀以及需要改進的地方。人力資源專業人員在審查訓練評估結果時,想知道哪些專案行之有效,哪些需要重新設計。在第一張投影片之前,框架至關重要。
第一步:在開發任何產品之前,先了解你的受眾。
同樣的調查數據需要根據在場人員的不同而採用不同的呈現方式。詳細的分解如下: 利開特式量表 將資訊分散到十個問題中,適合人力資源分析師團隊。而向財務長呈現的相同訊息,則需要精簡為兩到三個與業務成果直接相關的核心結論。
在撰寫報告或製作簡報之前,請先回答以下問題:
- 觀眾需要做什麼決定?
- 他們對這項調查及其目標已經了解多少?
- 他們將有多少時間來審查或觀看演示?
- 他們認為什麼樣的統計數據細節才算有用,什麼樣的細節細節又會讓他們感到不知所措?
對於領導階層聽眾,首先要闡述最重要的發現。對於從業人員聽眾,可以逐步展開更多細節。對於混合型聽眾,簡報結構應先呈現主要發現,後呈現支持性數據,以便利害關係人在了解關鍵要點後即可離場,而分析團隊可以留下來聽完剩餘內容。
步驟二:在可視化之前篩選數據
一份包含30個問題的問卷會產生30個數據點,但這並不代表你需要展示全部30個數據點。大多數問卷中只有三到五個結果真正對當前決策至關重要。其餘的充其量只是背景訊息,最糟的情況則是噪音。
仔細分析結果,問問自己:哪些發現令人驚訝、意義重大或有實際意義?如果一個問題的答案94%都相同,那麼這個問題幾乎沒有任何價值,很可能可以刪除。而如果一個問題的答案在不同部門之間差異很大,或者自上次調查以來趨勢發生了顯著變化,那麼這個問題通常應該在最終報告中呈現。
篩選這一步是大多數演講者容易忽略的。展示所有內容看似詳盡,但實際上就像在教科書中劃重點一樣:當所有內容都被標記為重要時,就等於沒有重要的內容。
步驟 3:選擇與資料相符的圖表類型
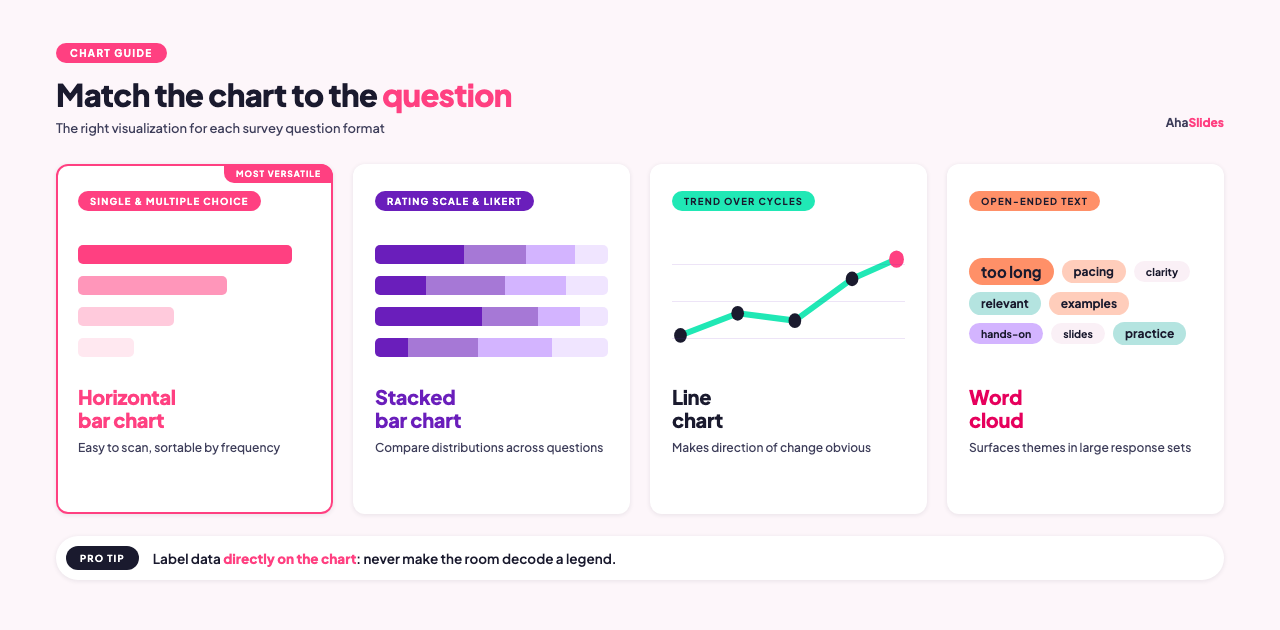
不同的問題形式需要不同的視覺化方式。使用錯誤的圖表類型會使準確的數據更難理解。
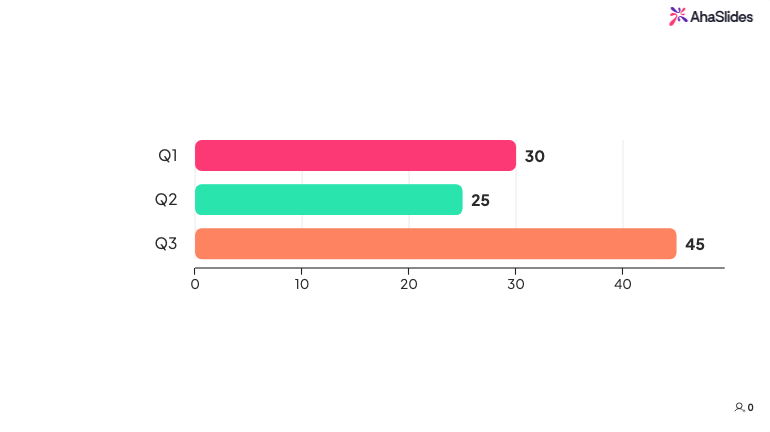
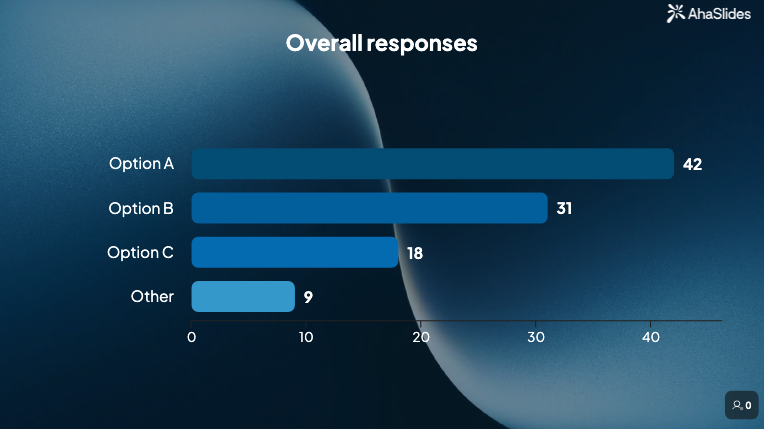
單選題和多選題 水平長條圖效果很好。長條圖易於瀏覽,可以處理任意數量的類別,並且可以按頻率對答案進行排序,從而立即顯示模式[1]。圓餅圖適用於選項不超過四個的單選題,這類題的重點在於顯示選項與整體的比例,但如果扇形超過五個,餅圖就難以閱讀了。
評分量表和李克特量表問題 最好用堆疊條形圖來展示,其中每個條形代表一個問題,條形之間的分段顯示了答案在量表上的分佈[2]。這樣可以在單一圖表中比較多個問題的回答模式。
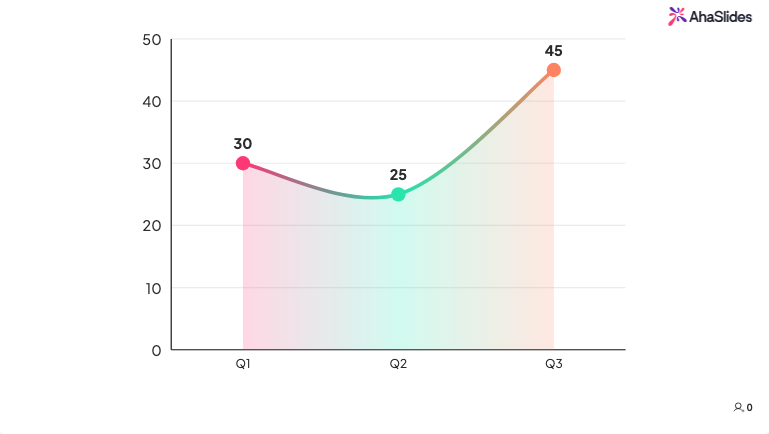
趨勢數據將本週期結果與上一週期結果進行比較時,最好使用簡單的折線圖或並排長條圖。目的是讓變化方向一目了然。
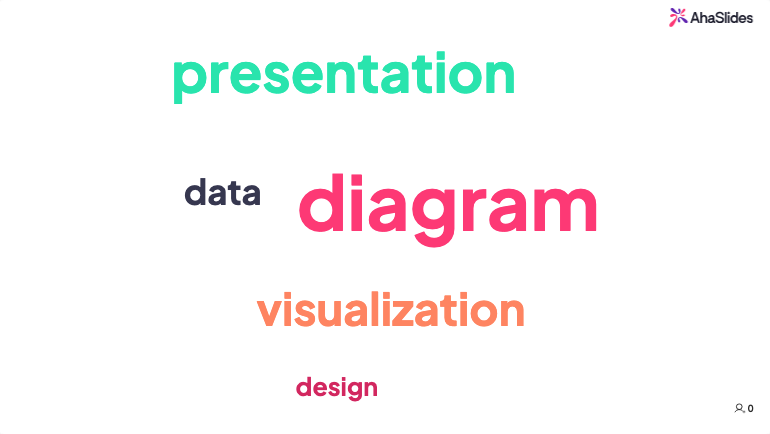
開放式文字回复 不必以原始引語的形式呈現(儘管一些精心挑選的引語也能起到很好的效果)。詞雲可以快速顯示最常用的詞語,這對於在大量回復中發現主題非常有用。
所有圖表類型都應遵循一條共同原則:直接在圖表上標註數據,而不是依賴圖例。觀眾不應該需要查閱顏色圖例才能理解圖表內容。
第四步:建構敘事,而非羅列清單
一個有用的簡報和一個容易被遺忘的簡報之間的區別,往往在於簡報者是試圖講述一個故事,還是只是報告數字[3]。
調查結果的敘述結構通常如下所示:
語境: 調查內容是什麼?哪些人參與了調查?調查時間是什麼時候?請用一張投影片或幾句話概括。觀眾只需要足夠的資訊來信任數據,而不是一份完整的調查方法報告。
主要發現: 先從最重要的結果著手。將其表述為陳述句,而非疑問句。 「62%的員工表示他們沒有足夠的資訊來了解影響其工作的決策」是一個調查結果。 「員工如何看待內部溝通?」則是一個引導性問題,而非調查結果。
補充細節: 兩到三個數據點,可以豐富主要結論的內容。這時,圖表豐富的投影片就派上用場了。
比較或背景: 與先前的調查期間、產業基準或其他團隊或部門相比,這個結果如何?數字與事物連結起來才更有意義。
意義: 這項發現實際意義何在?這就需要將數據與受眾需要做出的決策連結起來。
建議: 接下來該怎麼做?即使演講者沒有最終答案,演講也應該以明確的選項結束,而不是讓聽眾自己去思考其中的含義。
第五步:將調查結果與業務目標連結起來
脫離組織優先事項的調查數據很少能推動行動。如果調查是關於培訓效果的,那麼就應該將調查結果與影響績效或員工留任的技能差距連結起來。如果調查是關於員工敬業度的,那麼就應該將調查結果與員工流失風險或生產力指標連結起來。
將數據與組織已關注的結果結合並非粉飾,而是提供背景資訊。例如,「配送部門38%的員工很少將培訓技能運用到日常工作中」這項發現,如果與同一部門的員工流動率數據結合起來,比單獨呈現更具指導意義。
第六步:確定格式和交付方式
分享結果的方式應該與受眾和發現的緊迫性相符[4]。
當研究結果意義重大、預計會有人提問,或是你想與大家即時討論其影響時,現場演示效果最佳。現場演示讓你能夠觀察現場情況並靈活調整。如果圖表讓大家感到困惑,你可以當場解釋說明。
對於需要以自己節奏消化數據或與未參加原會議的人員分享數據的受眾來說,書面報告或共享的幻燈片簡報非常適用。報告在現場演示後也可用作參考文件。
對於定期進行的訓練評估和快速調查,顯示即時結果的儀錶板可以完全取代週期性報告。團隊無需等待預定的審查會議,即可隨時了解趨勢。
使用 AhaSlides 進行即時調查結果演示
AhaSlides是一個一體化的觀眾互動平台,可在一個會話中實現投票、評分量表、詞雲、開放式問題和問答等功能。對於主持現場課程的培訓師和引導員而言, 啊哈幻燈片 允許您在會議期間即時展示調查結果。投票結果、評分量表回復和詞雲輸出會隨著參與者的回應而更新,因此您可以趁熱打鐵地與與會者分享調查結果,而無需將結果匯總成幾天后才能發布的報告。
這對於訓練後的評估尤其有用,因為與一週後閱讀總結報告相比,看到小組的整體信心評分往往能引發更坦誠的討論。當60%的學員表示對某項關鍵技能缺乏信心,並且該數據在總結討論期間顯示在屏幕上時,接下來的情況就會有所不同:培訓師可以立即解決技能差距,而學員也能意識到自己並非孤軍奮戰。
AhaSlides還能將回覆匯出為電子表格數據,以便在會後進行更詳細的分析。因此,現場演示和會後報告都基於同一套數據,無需額外步驟。與其說它是一份總結報告,不如說它更像是一個即時記分板。當人們能夠即時看到數據時,他們的反應也會有所不同。
常見的錯誤,以避免
提出每一個問題。 聽眾無法在一次會議中吸收 25 個數據點。務必精簡內容。將不太重要的問題移至附錄,以便在需要時提供數據,但要確保主要演示內容集中於真正值得聽眾關注的三到五個發現。
使用了錯誤的圖表類型。 一個只有八個扇形的餅圖無法提供任何資訊。而一個堆疊長條圖,用於比較五個問題中李克特量表的分佈情況,則能提供很多資訊。在最終確定任何視覺化圖表之前,請先詢問一位不熟悉該調查的同事,他/她是否能在十秒鐘內正確解讀圖表。如果不能,請簡化圖表或更換格式。
跳過「那又怎樣」這個問題。 缺乏解讀的數據會迫使聽眾自行得出結論,而這往往意味著他們無法得出結論。每一項發現都應該用一句話解釋其在實際應用上的意義。如果無法寫出這句話,那麼這項發現可能就不適合出現在簡報中。
掩蓋頭條新聞。 在20分鐘的演講中,先用5分鐘講解方法論,最後才引出主要發現,絕對會讓人失去聽眾。應該在第二或第三張幻燈片就直接呈現最重要的結果,然後再為有興趣的人提供背景資訊和細節。
呈現的細節層次不當。 領導團隊所需的數據版本可能與設計問卷的團隊有所不同。如有疑問,請準備一份簡要版本,並保留更詳細的備份,以便在深入討論時隨時調取。
常見問題
調查結果報告應該要多長?
對於大多數領導階層或利害關係人而言,15 到 20 分鐘是理想的時間。這段時間通常足以涵蓋三到五項關鍵發現,並為每項發現提供支持性背景信息,最後提出建議。如果發現較為複雜,或者聽眾希望獲得詳細的講解,那麼 30 分鐘就是一個合理的上限。超過這個時長,應該安排為研討會或工作會議,而不是正式的演講。
附錄該放些什麼?
請將您從主簡報中刪除但相關利益方可能會詢問的所有內容都包含在附錄中:包括逐題分析、人口統計細分、開放式回答原文以及任何方法論說明。附錄既能縮短主簡報的長度,又不會使基礎資料難以取得。
當調查結果不利於自己時,該如何呈現?
準確報告數據並結合上下文。如果參與度得分大幅下降,請務必明確指出,並列出可能導致下降的因素,同時準備好應對方案。相較於含糊其辭、避重就輕的結果,受眾通常更樂於接受坦誠的調查結果和清晰的計劃。
來源
[1] 煉金術士。 圓餅圖還是長條圖?用於呈現調查結果。 https://www.alchemer.com/resources/blog/pie-chart-or-bar-graph/
[2] 繁榮。 5 種有效可視化調查回覆的方法。 https://flourish.studio/blog/visualizing-survey-data/
[3] 復仇。 如何有效地呈現調查結果。 https://venngage.com/blog/survey-results/
[4] 洞察7。 向利害關係人展示調查數據的最佳方法。 https://insight7.io/top-methods-for-presenting-survey-data-to-stakeholders/
[5] 麥肯錫全球研究院。 分析時代:在數據驅動的世界中競爭。 https://www.mckinsey.com/capabilities/quantumblack/our-insights/the-age-of-analytics-competing-in-a-data-driven-world