



According to survey research from Pew Research Center, questionnaire development isn't an art, it's a science. Yet most organizations approach survey design intuitively, resulting in three critical failures:
Response bias: Questions unintentionally guide respondents toward certain answers, rendering data worthless.
Respondent burden: Surveys that feel difficult, time-consuming, or emotionally draining lead to low completion rates and poor-quality responses.
Measurement error: Unclear questions mean respondents interpret them differently, making your data impossible to analyze meaningfully.
The good news? Research from Imperial College London and other leading institutions has identified specific, replicable principles that eliminate these problems. Follow them, and your questionnaire response rates can increase by 40-60% while dramatically improving data quality.
The eight non-negotiable characteristics of professional questionnaires
Before diving into question development, ensure your questionnaire framework satisfies these evidence-based criteria:
Crystal clarity: Respondents understand exactly what you're asking. Ambiguity is the enemy of valid data.
Strategic brevity: Concise without sacrificing context. Harvard research shows 10-minute surveys get 25% higher completion than 20-minute versions.
Laser specificity: General questions yield vague answers. "How satisfied are you?" is weak. "How satisfied are you with response time to your last support ticket?" is strong.
Ruthless neutrality: Eliminate leading language. "Don't you agree our product is excellent?" introduces bias. "How would you rate our product?" doesn't.
Purposeful relevance: Every question must directly address a research objective. If you can't explain why you're asking it, delete it.
Logical flow: Group related questions together. Move from general to specific. Place sensitive demographic questions at the end.
Psychological safety: For sensitive topics, ensure anonymity and confidentiality. Clearly communicate data protection measures (GDPR compliance matters).
Effortless response: Make answering intuitive. Use visual hierarchy, white space, and clear response formats that work seamlessly across devices.
The seven-step research-backed questionnaire design process
Step 1: Define objectives with surgical precision
Vague objectives produce useless questionnaires. "Understand customer satisfaction" is too broad. Instead: "Measure NPS, identify top 3 friction points in onboarding, and determine likelihood of renewal among enterprise customers."
Framework for objective setting: Clarify your research type (exploratory, descriptive, explanatory, or predictive). Specify exact information needed. Define target population precisely. Ensure objectives guide measurable outcomes, not processes.
Step 2: Develop questions that eliminate cognitive bias
Imperial College research demonstrates that agree-disagree response formats are among the "worst ways to present items" because they introduce acquiescence bias, respondents' tendency to agree regardless of content. This single flaw can invalidate your entire dataset.
Evidence-based question design principles:
Word items as questions, not statements: "How helpful was our support team?" outperforms "Our support team was helpful (agree/disagree)."
Use verbally labeled scales: Label every response option ("Not at all helpful, Slightly helpful, Moderately helpful, Very helpful, Extremely helpful") rather than just endpoints. This reduces measurement error.
Avoid double-barreled questions: "How happy and engaged are you?" asks two things. Separate them.
Apply appropriate question formats: Closed-ended for quantitative data (easier analysis). Open-ended for qualitative insights (richer context). Likert scales for attitudes (5-7 points recommended).
Step 3: Format for visual hierarchy and accessibility
Research shows that visual design directly impacts response quality. Poor formatting increases cognitive load, leading respondents to satisfice, providing low-quality answers just to finish.
Critical formatting guidelines:
Equal visual spacing: Maintain equal distances between scale points to reinforce conceptual equality and reduce bias.
Separate non-substantive options: Add extra space before "N/A" or "Prefer not to answer" to distinguish them visually.
Generous white space: Reduces cognitive fatigue and improves completion rates.
Progress indicators: For digital surveys, show completion percentage to maintain motivation.
Mobile optimization: Over 50% of survey responses now come from mobile devices. Test rigorously.
Step 4: Conduct rigorous pilot testing
Pew Research Center uses extensive pre-testing through cognitive interviews, focus groups, and pilot surveys before full deployment. This catches ambiguous wording, confusing formats, and technical issues that destroy data quality.
Pilot test with 10-15 target population representatives. Measure completion time, identify unclear questions, assess logical flow, and gather qualitative feedback through follow-up conversations. Revise iteratively until confusion disappears.
Step 5: Deploy with strategic distribution
Distribution method affects response rates and data quality. Choose based on your audience and sensitivity of content:
Digital surveys: Fastest, most cost-effective, ideal for scalability and real-time data.
Email distribution: High reach, personalization options, trackable metrics.
In-person administration: Higher response rates, immediate clarification, better for sensitive topics.
Pro engagement tip: A shareable link or QR code lets respondents complete a survey on their own time, on any device, without a live session. AhaSlides Survey is built for exactly this.
Step 6: Analyze data with statistical rigor
Compile responses systematically using spreadsheet software or specialized analysis tools. Check for missing data, outliers, and inconsistencies before proceeding.
For closed-ended questions, calculate frequencies, percentages, means, and modes. For open-ended responses, apply thematic coding to identify patterns. Use cross-tabulation to reveal relationships between variables. Document factors affecting interpretation such as response rates and demographic representation.
Step 7: Interpret findings within proper context
Always revisit original objectives. Identify consistent themes and significant statistical relationships. Note limitations and external factors. Quote response examples that illustrate key insights. Identify gaps requiring further research. Present findings with appropriate caution about generalizability.
Common questionnaire design pitfalls (and how to avoid them)
Leading questions: "Don't you think X is important?" becomes "How important is X to you?"
Assumed knowledge: Define technical terms or acronyms, not everyone knows your industry jargon.
Overlapping response options: "0-5 years, 5-10 years" creates confusion. Use "0-4 years, 5-9 years."
Loaded language: "Our innovative product" introduces bias. Stay neutral.
Excessive length: Each additional minute reduces completion rates by 3-5%. Respect respondent time.
How to create a questionnaire with AhaSlides Survey
AhaSlides Survey builds a single-page, multi-question form that respondents complete on their own time, on any device, no live session or scheduling required. Here's how to set one up in a few minutes.
Step 1: Sign up for a free AhaSlides account, then open Surveys from the sidebar and create a new survey.
Step 2: Add your questions. Mix question types to match what you're measuring: linear scale for Likert-style ratings, multiple choice for quick options, and long text for open feedback.
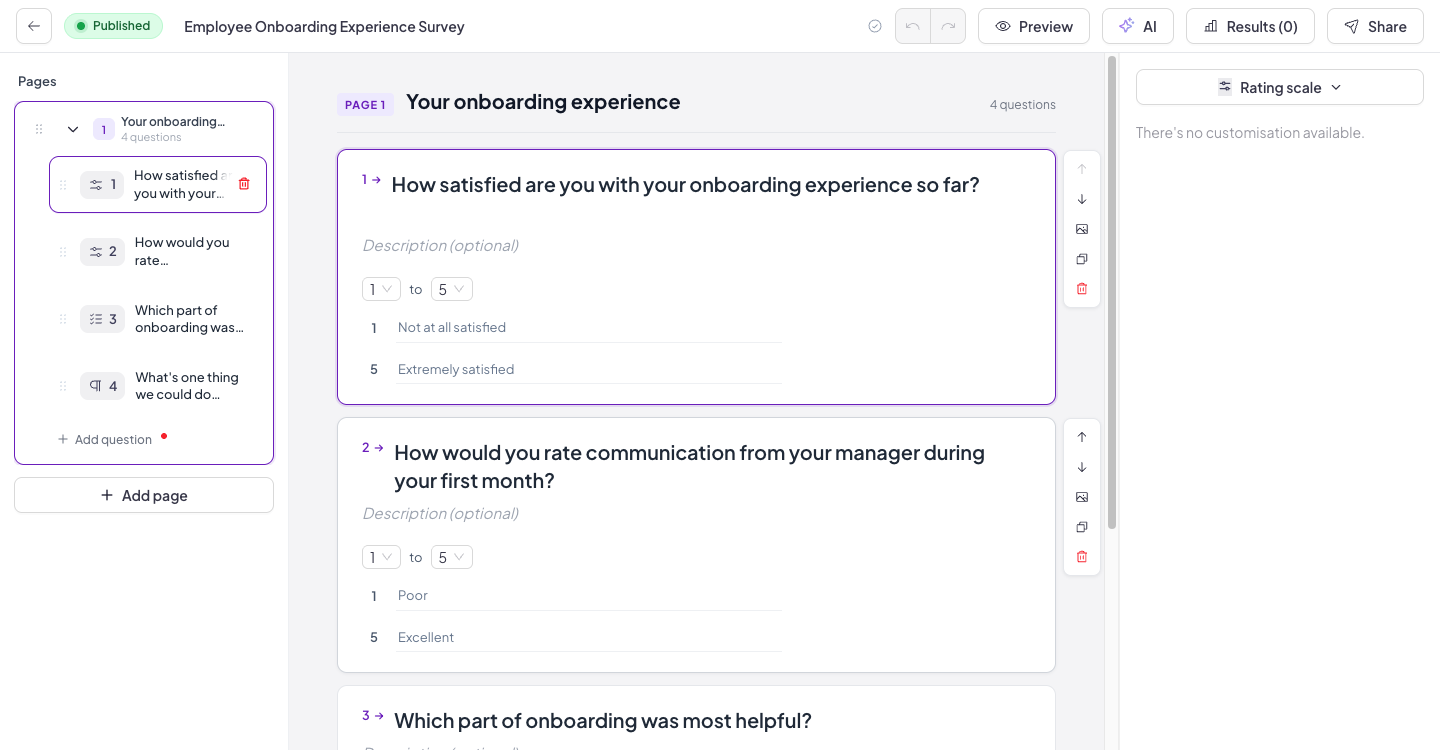
Step 3: Label both ends of every scale (for example, "Not at all satisfied" to "Extremely satisfied") rather than just the endpoints, the same evidence-based formatting covered in Step 2 above, to reduce measurement error.
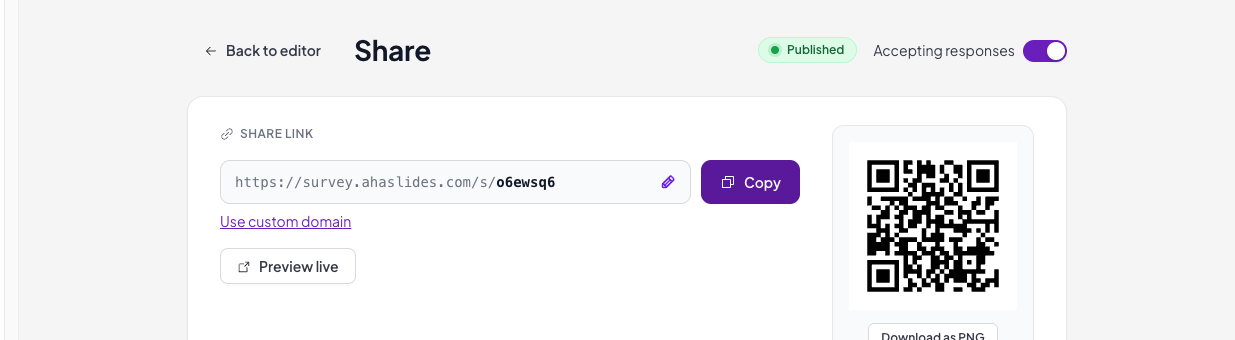
Step 4: Publish the survey, then share it with a link or QR code. There's nothing to schedule since respondents can answer whenever suits them.
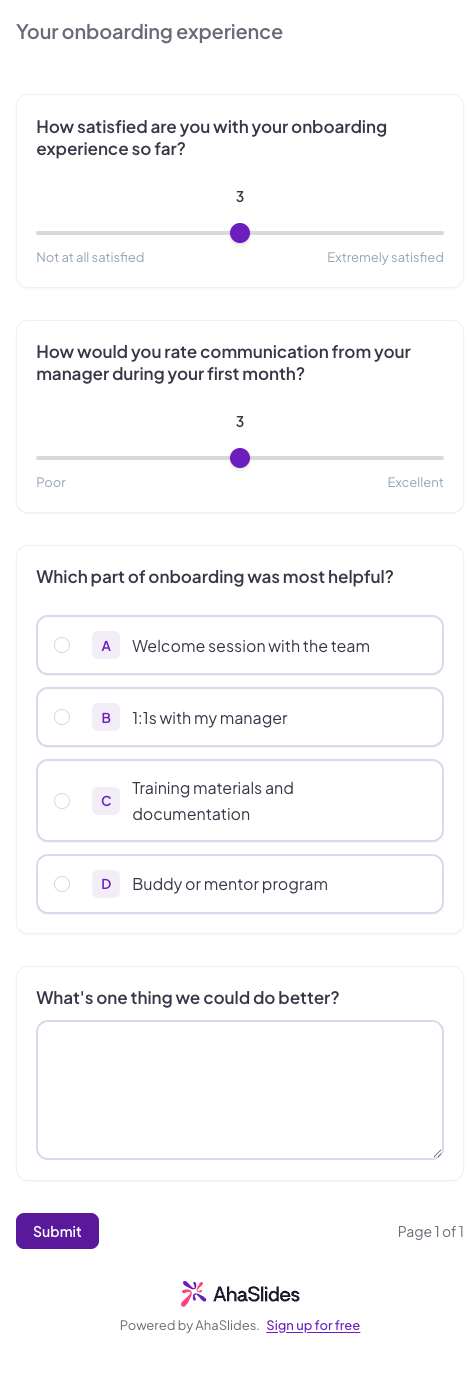
Step 5: Respondents see every question on one scrollable page, with a progress bar and validation on required questions, then submit when they're done.
Tip: Open the Results tab to see response counts update live and export answers as they come in.
Frequently asked questions
What are the five steps in designing a questionnaire?
The five steps to design a questionnaire are: define the research objectives, decide on the questionnaire format, develop clear and concise questions, arrange the questions logically, and pretest and refine the questionnaire.
What are the 4 types of questionnaires in research?
There are 4 types of questionnaires in research: structured, unstructured, semi-structured, and hybrid.
What are 5 good survey questions?
The 5 good survey questions, what, where, when, why, and how, are basic but answering them before starting your survey would help drive a better result.
.webp)