甘特圖看起來像是一些只有專業人士才能理解的項目管理秘密代碼。
但不要擔心——一旦你了解了它們的工作原理,它們實際上非常簡單。
我們將解釋一切,回答您的問題,從什麼是甘特圖到如何在您的項目中有效地使用它。
| Excel 上的甘特圖是什麼? | Excel 上的甘特圖是一種條形圖,可幫助您可視化項目時間表。 |
| 為什麼他們稱其為甘特圖? | 甘特圖以亨利·甘特 (Henry Gantt) 的名字命名,他在 1910 年至 1915 年左右普及了甘特圖。 |
| 為什麼使用甘特圖很好? | 甘特圖可以幫助您縱覽全局、有效組織任務並讓每個人都步入正軌。 |
目錄
什麼是甘特圖
甘特圖基本上是一個列出項目時間表的圖表。
它顯示每個任務的開始和結束日期,以及任務之間的依賴關係,以確保一切都按正確的順序完成。 乾淨利落。
甘特圖有幾個關鍵部分:
- 任務列表:項目中的每個任務在圖表上都有自己的行。
- 時間軸:圖表包含標記時段的橫軸-通常是天、週或月。
- 開始和完成日期:每個任務都會有一個欄顯示其沿時間線的開始和結束時間。
- 依賴性:連接顯示是否必須完成一項任務才能開始另一項任務。

甘特圖有什麼用?
使用甘特圖有利於項目管理有以下幾個原因:
• 它提供了項目時間表的清晰視覺表示。 能夠以直觀方式查看任務、持續時間、依賴關係和里程碑,讓您一目了然地了解完整的日程安排。

• 它有助於及早發現日程安排問題。 查看甘特圖,您可以發現潛在的瓶頸、關鍵任務的重疊或時間線中可能導致延遲的間隙。 然後您可以進行調整以避免出現問題。
• 它有助於向利益相關者傳達時間表。 通過共享甘特圖,您可以為團隊成員和客戶提供一種簡單的方式來查看時間線、任務所有者、依賴關係和計劃的里程碑。 這促進了透明度和問責制。
• 它使進度跟踪變得清晰。 當您更新甘特圖以顯示已完成的任務、正在進行的任務和任何變更時,該圖表會為您和其他團隊成員提供專案狀態的「一目了然」視圖。
• 它有助於有效地管理資源。 當具有資源依賴性的任務以可視化方式佈置時,您可以在整個時間線上優化人員、設備和其他資產的利用率。
• 它允許進行假設情景規劃。 通過更改甘特圖上的任務持續時間、依賴性和順序,您可以對不同的場景進行建模,以確定最佳的項目計劃,然後再實際實施。
甘特圖是什麼樣的?

甘特圖在時間線上直觀地繪製任務。 它通常包括:
• 沿左側垂直軸的任務列表。 每個任務都有自己的行。
• 底部的水平時間刻度,通常顯示天、週或月等增量。
• 對於每個任務,都有一個從其計劃開始日期到結束日期的長條圖。長條圖的長度表示該任務的計畫持續時間。
• 任務之間的依賴性通過連接任務的線條或箭頭來顯示。 這顯示了哪些任務必須在其他任務開始之前完成。
• 里程碑在特定日期用垂直線或圖標表示。 它們標記重要的檢查點或截止日期。
• 分配給每個任務的資源可能會顯示在任務欄或單獨的列中。
• 實際進度有時會透過表示已完成工作的任務列的雜湊、陰影或顏色編碼部分來表示。
甘特圖和 Pert 圖有什麼共同點?
甘特圖和 PERT 圖都:
• 是項目調度和管理工具。
• 直觀地表示包含任務、里程碑和持續時間的項目時間表。
• 幫助識別項目計劃中的風險、依賴性和潛在問題。
• 可以更新以反映任務進度和日程安排的更改。
• 協助分配和跟踪資源利用情況。
• 促進項目狀態和績效的監控。
• 通過提供項目時間表和狀態的清晰可視化表示來改善溝通。

甘特圖和 PERT 圖之間的主要區別是:
甘特圖:
• 顯示每項任務的計劃開始和結束日期。
• 更多地關注任務的安排和時間安排。
• 使用簡單的條形圖格式。
PERT 圖表:
• 根據樂觀、悲觀和最可能的估計計算任務的預期持續時間。
• 更多地關注決定任務順序的邏輯網絡。
• 使用節點和箭頭圖格式來顯示任務之間的依賴性和邏輯。
總之,甘特圖和 PERT 圖都旨在對項目進度進行建模和可視化。 他們幫助規劃、跟踪進度和溝通。 但甘特圖更關注任務的時間線和時間安排,而 PERT 圖更關注任務之間的邏輯和依賴關係,以確定預期持續時間。
如何製作甘特圖
在電子表格中建立甘特圖可以讓您在專案進度中輕鬆追蹤、更新和「假設」情境規劃。
以下是在項目管理中製作基本甘特圖的步驟:
1. 列出完成專案所需的所有任務。將大任務分解成更小、更易於管理的子任務。
#2 – 用適合你專案的時間單位(天、週、月等)估算每個任務的持續時間。考慮任務之間的依賴關係。
3. 為每個任務分配負責人和/或資源。識別任何存在任務依賴關係衝突的共享資源。
4. 確定專案的開始日期和截止日期。根據依賴關係計算任務開始日期。
#5 – 建立表格或 電子表格 包含以下列:
- 任務名稱
- 任務持續時間
- 開始日期
- 完成日期
- 分配的資源
- 完成百分比(可選)
- 任務依賴關係(可選)

#6 – 在時間線上以橫條標示任務,從開始日期到結束日期。
#7 – 使用箭頭或線條來加入任務之間依賴關係的視覺表示。
#8 – 使用圖示、陰影或垂直線在時間線上標記重要里程碑。
#9 – 隨著任務完成、工期變化或依賴關係變化,定期更新甘特圖。根據需要調整工作列和依賴關係。
#10 – 新增完成百分比或進度列,並隨時間填寫,以一目了然地指示專案狀態。
#11 – 使用視覺化時間軸識別可能導致延誤的進度安排問題、資源衝突或風險。主動進行調整,改善專案計畫。
甘特圖軟件
市場上有如此多的選擇,這些產品以其多功能的功能和簡單的界面吸引了我們的眼球。 從即將退休的老闆到新實習生,每個人都可以輕鬆查看、創建和跟踪甘特圖。
1. Microsoft Project
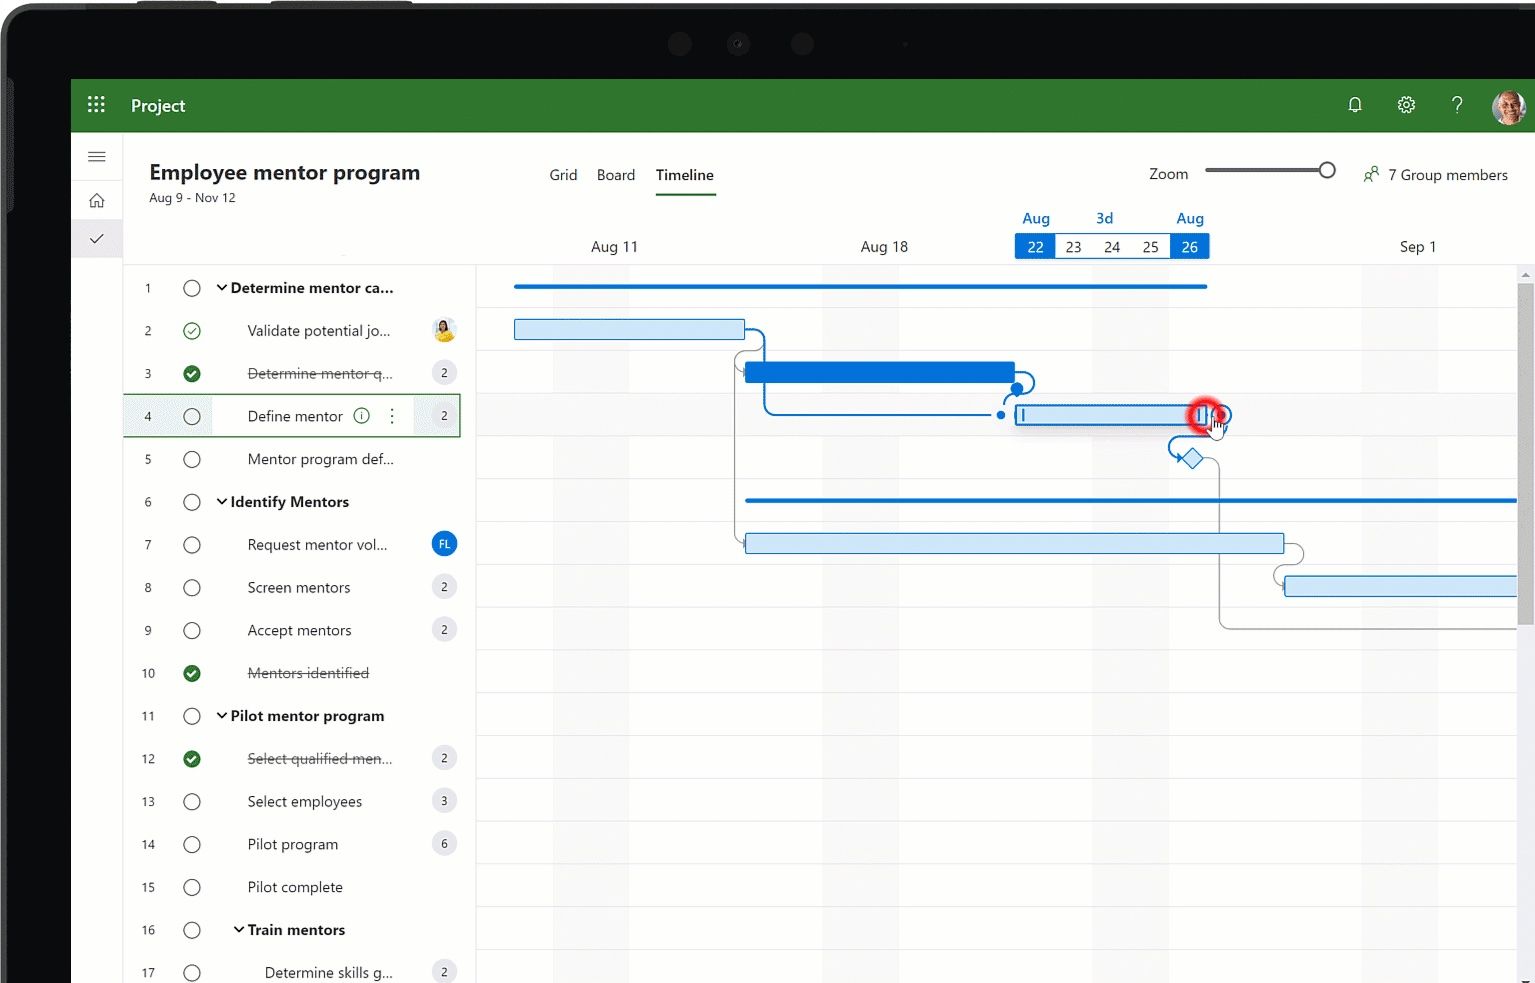
• 功能齊全的項目管理應用程序。
• 可以輕鬆創建和編輯任務、資源、分配和日曆日期的表格。
• 根據表格數據自動生成甘特圖。
• 允許關鍵路徑、截止日期、資源平衡和其他高級功能。
• 與Excel、Outlook 和SharePoint 集成以進行項目協作。
• 需要購買按月或按年訂閱。
2. Microsoft Excel

• 很簡單,只需將任務詳細信息輸入表格並從中生成圖表即可。
• 許多免費或廉價的甘特圖插件,具有更多模板和功能。
• 大多數人都熟悉的界面。
• 除了基本甘特圖之外,項目管理能力有限。
#3 – 甘特圖

• 專為甘特圖設計的開源項目管理應用程序。
• 具有描述任務、分配資源、跟踪進度和生成報告的功能。
• 允許重複任務、任務依賴性以及計算關鍵路徑。
• 對於某些人來說,界面可能不太直觀。
• 缺乏與其他軟件和協作功能的集成。
• 免費下載和使用。
#4 – SmartDraw

• 包括專業設計的甘特圖模板。
• 具有自動時間線創建、拖放編輯和任務依賴性的功能。
• 與Microsoft Office 集成以交換文件和數據。
• 相對易於使用的界面。
• 需要付費訂閱,但提供 30 天免費試用。
#5 – Trello

• 看板式項目管理工具。
• 將任務新增為“卡片”,您可以將其拖曳並在時間軸上直觀地排列。
• 查看從幾周到幾個月的多個時間範圍內的任務。
• 為卡片分配成員和截止日期。
• 處理任務之間的依賴性、管理資源和資產利用率以及跟踪里程碑進度的基礎。
#6 – TeamGantt

• 專門針對全生命週期項目管理的一體化解決方案。
• 自動化時間線規劃和優化。
• 讓您定義任務依賴關係、模擬「假設」場景、在多個專案之間分配和平衡資源,以及追蹤里程碑的進度。
• 附帶模板庫和分析報告。
• 需要付費訂閱。
#7 –體位法

• 專注於任務管理的項目管理應用程序。
• 缺乏:跨項目的資源管理、掙值分析和假設情景規劃。
• 免費版本。 付費等級可獲取更多功能。
什麼是甘特圖示例?
甘特圖可用於多種情況。 以下是一些主要示例:
• 項目進度表:甘特圖可以直觀地列出任何類型項目的時間線,包括任務、持續時間、依賴性和里程碑。 這可以用於建築項目、活動策劃、軟件工程、研究等。

• 製造計劃:甘特圖通常在製造中用於計劃生產運行,顯示從材料採購到組裝再到包裝和運輸的所有步驟的計劃。
• 資源分配:甘特圖可以幫助優化跨多個項目的資源分配,例如人員、設備和設施。 按資源對任務進行顏色編碼可以使這一點變得清晰。
• 進度跟踪:可以更新正在進行的項目的甘特圖,以顯示已完成任務的實際開始/完成日期、正在進行的任務的延誤以及任何更改或延遲。 這提供了項目狀態的視圖。
• 假設場景:通過調整甘特圖上的任務序列、持續時間和依賴性,項目經理可以對替代方案進行建模,以便在實際實施之前確定最有效的時間表。
• 溝通工具:與利益相關者共享甘特圖,提供項目里程碑、任務所有者以及計劃與實際時間表的直觀摘要,從而促進一致性和問責制。
整體而言,甘特圖適用於任何場景,只要它能將一系列任務、依賴關係和時間軸視覺化,從而提供洞察,幫助優化計劃、分配資源、追蹤進度並溝通狀態。具體範例數不勝數,只受限於人們的創造力以及對清晰度和效率的需求。
投資訊息
甘特圖非常有效,因為它們將復雜的項目時間表和依賴關係轉化為易於理解、更新和共享的簡單視覺效果。 主要好處在於改進了調度、溝通、進度跟踪和規劃,這使得它們受到項目經理的青睞。
常見問題(FAQ)
為什麼甘特圖這麼好?
為什麼甘特圖有效
- 視覺化時間軸-一眼就能看到完整的計劃
- 早期問題檢測-直觀地發現潛在問題
- 溝通-促進清晰度和責任感
- 規劃-依賴關係和優先順序變得清晰
- 進度追蹤-更新的圖表顯示狀態
- 假設分析—模型替代方案
- 整合-與專案管理軟體協同工作
甘特圖將復雜的時間線和依賴關係轉化為易於理解、更新和共享的簡單視覺效果。
好處來自改進的調度、溝通、跟踪和規劃
甘特圖的 4 個組成部分是什麼?
甘特圖需要 4 個方面:條形圖、柱形圖、日期和里程碑。
甘特圖是時間線嗎?
是的——甘特圖本質上是一種專案進度的可視化時間軸表示,有助於規劃、協調和管理。此圖表在 xy 軸上繪製任務訊息,將複雜的時間安排、依賴關係和持續時間轉化為簡單易讀的格式。